Hallo,
sorry, dass ich mich jetzt so lange nicht gemeldet habe. Hatte haufen Zeugs um die Ohren. Ausserdem wollte der Rechner heute erst mal gar nicht mehr booten, bis der Speicher überprüft wurde und haufen Verweise korrigiert wurden (von Windows aus).
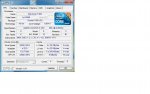
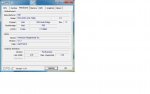
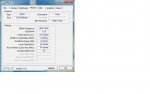
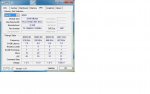
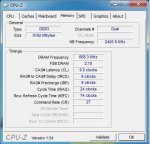
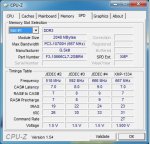
Anbei erst mal die Screens von CPU-Z.
Memtest 86+ habe ich jetzt auch nochmal probiert. Der erste Test brachte keine Probleme. Komplett konnte ich ihn noch nicht durchlaufen lassen.
Laut Aussagen von den Spezis im Laden wurde aber mit den neuesten Tests die Komponenten getestet.
Was soll ich als nächstes testen/machen?
Anbei noch was die Debugging Tools zu dem Bluescreen sagen:
Microsoft (R) Windows Debugger Version 6.10.0003.233 X86
Copyright (c) Microsoft Corporation. All rights reserved.
Loading Dump File [C:\Users\micha\Desktop\Minidump\062110-12246-01.dmp]
Mini Kernel Dump File: Only registers and stack trace are available
Symbol search path is: *** Invalid ***
****************************************************************************
* Symbol loading may be unreliable without a symbol search path. *
* Use .symfix to have the debugger choose a symbol path. *
* After setting your symbol path, use .reload to refresh symbol locations. *
****************************************************************************
Executable search path is:
*********************************************************************
* Symbols can not be loaded because symbol path is not initialized. *
* *
* The Symbol Path can be set by: *
* using the _NT_SYMBOL_PATH environment variable. *
* using the -y <symbol_path> argument when starting the debugger. *
* using .sympath and .sympath+ *
*********************************************************************
Unable to load image \SystemRoot\system32\ntoskrnl.exe, Win32 error 0n2
*** WARNING: Unable to verify timestamp for ntoskrnl.exe
*** ERROR: Module load completed but symbols could not be loaded for ntoskrnl.exe
Windows 7 Kernel Version 7600 MP (8 procs) Free x64
Product: WinNt, suite: TerminalServer SingleUserTS
Built by: 7600.16539.amd64fre.win7_gdr.100226-1909
Machine Name:
Kernel base = 0xfffff800`0281a000 PsLoadedModuleList = 0xfffff800`02a57e50
Debug session time: Mon Jun 21 21:05:47.490 2010 (GMT+2)
System Uptime: 0 days 0:00:07.614
*********************************************************************
* Symbols can not be loaded because symbol path is not initialized. *
* *
* The Symbol Path can be set by: *
* using the _NT_SYMBOL_PATH environment variable. *
* using the -y <symbol_path> argument when starting the debugger. *
* using .sympath and .sympath+ *
*********************************************************************
Unable to load image \SystemRoot\system32\ntoskrnl.exe, Win32 error 0n2
*** WARNING: Unable to verify timestamp for ntoskrnl.exe
*** ERROR: Module load completed but symbols could not be loaded for ntoskrnl.exe
Loading Kernel Symbols
...............................................................
..................
Loading User Symbols
*******************************************************************************
* *
* Bugcheck Analysis *
* *
*******************************************************************************
Use !analyze -v to get detailed debugging information.
BugCheck A, {fffffc00063dcb58, 2, 0, fffff80002909418}
*** WARNING: Unable to verify timestamp for mssmbios.sys
*** ERROR: Module load completed but symbols could not be loaded for mssmbios.sys
Unable to load image \SystemRoot\system32\DRIVERS\ataport.SYS, Win32 error 0n2
*** WARNING: Unable to verify timestamp for ataport.SYS
*** ERROR: Module load completed but symbols could not be loaded for ataport.SYS
Unable to load image \SystemRoot\system32\DRIVERS\atapi.sys, Win32 error 0n2
*** WARNING: Unable to verify timestamp for atapi.sys
*** ERROR: Module load completed but symbols could not be loaded for atapi.sys
***** Kernel symbols are WRONG. Please fix symbols to do analysis.
*************************************************************************
*** ***
*** ***
*** Your debugger is not using the correct symbols ***
*** ***
*** In order for this command to work properly, your symbol path ***
*** must point to .pdb files that have full type information. ***
*** ***
*** Certain .pdb files (such as the public OS symbols) do not ***
*** contain the required information. Contact the group that ***
*** provided you with these symbols if you need this command to ***
*** work. ***
*** ***
*** Type referenced: nt!_KPRCB ***
*** ***
*************************************************************************
*************************************************************************
*** ***
*** ***
*** Your debugger is not using the correct symbols ***
*** ***
*** In order for this command to work properly, your symbol path ***
*** must point to .pdb files that have full type information. ***
*** ***
*** Certain .pdb files (such as the public OS symbols) do not ***
*** contain the required information. Contact the group that ***
*** provided you with these symbols if you need this command to ***
*** work. ***
*** ***
*** Type referenced: nt!KPRCB ***
*** ***
*************************************************************************
*************************************************************************
*** ***
*** ***
*** Your debugger is not using the correct symbols ***
*** ***
*** In order for this command to work properly, your symbol path ***
*** must point to .pdb files that have full type information. ***
*** ***
*** Certain .pdb files (such as the public OS symbols) do not ***
*** contain the required information. Contact the group that ***
*** provided you with these symbols if you need this command to ***
*** work. ***
*** ***
*** Type referenced: nt!_KPRCB ***
*** ***
*************************************************************************
*************************************************************************
*** ***
*** ***
*** Your debugger is not using the correct symbols ***
*** ***
*** In order for this command to work properly, your symbol path ***
*** must point to .pdb files that have full type information. ***
*** ***
*** Certain .pdb files (such as the public OS symbols) do not ***
*** contain the required information. Contact the group that ***
*** provided you with these symbols if you need this command to ***
*** work. ***
*** ***
*** Type referenced: nt!_KPRCB ***
*** ***
*************************************************************************
*********************************************************************
* Symbols can not be loaded because symbol path is not initialized. *
* *
* The Symbol Path can be set by: *
* using the _NT_SYMBOL_PATH environment variable. *
* using the -y <symbol_path> argument when starting the debugger. *
* using .sympath and .sympath+ *
*********************************************************************
*********************************************************************
* Symbols can not be loaded because symbol path is not initialized. *
* *
* The Symbol Path can be set by: *
* using the _NT_SYMBOL_PATH environment variable. *
* using the -y <symbol_path> argument when starting the debugger. *
* using .sympath and .sympath+ *
*********************************************************************
Probably caused by : ntoskrnl.exe ( nt+ef418 )
Followup: MachineOwner
---------
sorry, dass ich mich jetzt so lange nicht gemeldet habe. Hatte haufen Zeugs um die Ohren. Ausserdem wollte der Rechner heute erst mal gar nicht mehr booten, bis der Speicher überprüft wurde und haufen Verweise korrigiert wurden (von Windows aus).
Anbei erst mal die Screens von CPU-Z.
Memtest 86+ habe ich jetzt auch nochmal probiert. Der erste Test brachte keine Probleme. Komplett konnte ich ihn noch nicht durchlaufen lassen.
Laut Aussagen von den Spezis im Laden wurde aber mit den neuesten Tests die Komponenten getestet.
Was soll ich als nächstes testen/machen?
Ergänzung ()
Anbei noch was die Debugging Tools zu dem Bluescreen sagen:
Microsoft (R) Windows Debugger Version 6.10.0003.233 X86
Copyright (c) Microsoft Corporation. All rights reserved.
Loading Dump File [C:\Users\micha\Desktop\Minidump\062110-12246-01.dmp]
Mini Kernel Dump File: Only registers and stack trace are available
Symbol search path is: *** Invalid ***
****************************************************************************
* Symbol loading may be unreliable without a symbol search path. *
* Use .symfix to have the debugger choose a symbol path. *
* After setting your symbol path, use .reload to refresh symbol locations. *
****************************************************************************
Executable search path is:
*********************************************************************
* Symbols can not be loaded because symbol path is not initialized. *
* *
* The Symbol Path can be set by: *
* using the _NT_SYMBOL_PATH environment variable. *
* using the -y <symbol_path> argument when starting the debugger. *
* using .sympath and .sympath+ *
*********************************************************************
Unable to load image \SystemRoot\system32\ntoskrnl.exe, Win32 error 0n2
*** WARNING: Unable to verify timestamp for ntoskrnl.exe
*** ERROR: Module load completed but symbols could not be loaded for ntoskrnl.exe
Windows 7 Kernel Version 7600 MP (8 procs) Free x64
Product: WinNt, suite: TerminalServer SingleUserTS
Built by: 7600.16539.amd64fre.win7_gdr.100226-1909
Machine Name:
Kernel base = 0xfffff800`0281a000 PsLoadedModuleList = 0xfffff800`02a57e50
Debug session time: Mon Jun 21 21:05:47.490 2010 (GMT+2)
System Uptime: 0 days 0:00:07.614
*********************************************************************
* Symbols can not be loaded because symbol path is not initialized. *
* *
* The Symbol Path can be set by: *
* using the _NT_SYMBOL_PATH environment variable. *
* using the -y <symbol_path> argument when starting the debugger. *
* using .sympath and .sympath+ *
*********************************************************************
Unable to load image \SystemRoot\system32\ntoskrnl.exe, Win32 error 0n2
*** WARNING: Unable to verify timestamp for ntoskrnl.exe
*** ERROR: Module load completed but symbols could not be loaded for ntoskrnl.exe
Loading Kernel Symbols
...............................................................
..................
Loading User Symbols
*******************************************************************************
* *
* Bugcheck Analysis *
* *
*******************************************************************************
Use !analyze -v to get detailed debugging information.
BugCheck A, {fffffc00063dcb58, 2, 0, fffff80002909418}
*** WARNING: Unable to verify timestamp for mssmbios.sys
*** ERROR: Module load completed but symbols could not be loaded for mssmbios.sys
Unable to load image \SystemRoot\system32\DRIVERS\ataport.SYS, Win32 error 0n2
*** WARNING: Unable to verify timestamp for ataport.SYS
*** ERROR: Module load completed but symbols could not be loaded for ataport.SYS
Unable to load image \SystemRoot\system32\DRIVERS\atapi.sys, Win32 error 0n2
*** WARNING: Unable to verify timestamp for atapi.sys
*** ERROR: Module load completed but symbols could not be loaded for atapi.sys
***** Kernel symbols are WRONG. Please fix symbols to do analysis.
*************************************************************************
*** ***
*** ***
*** Your debugger is not using the correct symbols ***
*** ***
*** In order for this command to work properly, your symbol path ***
*** must point to .pdb files that have full type information. ***
*** ***
*** Certain .pdb files (such as the public OS symbols) do not ***
*** contain the required information. Contact the group that ***
*** provided you with these symbols if you need this command to ***
*** work. ***
*** ***
*** Type referenced: nt!_KPRCB ***
*** ***
*************************************************************************
*************************************************************************
*** ***
*** ***
*** Your debugger is not using the correct symbols ***
*** ***
*** In order for this command to work properly, your symbol path ***
*** must point to .pdb files that have full type information. ***
*** ***
*** Certain .pdb files (such as the public OS symbols) do not ***
*** contain the required information. Contact the group that ***
*** provided you with these symbols if you need this command to ***
*** work. ***
*** ***
*** Type referenced: nt!KPRCB ***
*** ***
*************************************************************************
*************************************************************************
*** ***
*** ***
*** Your debugger is not using the correct symbols ***
*** ***
*** In order for this command to work properly, your symbol path ***
*** must point to .pdb files that have full type information. ***
*** ***
*** Certain .pdb files (such as the public OS symbols) do not ***
*** contain the required information. Contact the group that ***
*** provided you with these symbols if you need this command to ***
*** work. ***
*** ***
*** Type referenced: nt!_KPRCB ***
*** ***
*************************************************************************
*************************************************************************
*** ***
*** ***
*** Your debugger is not using the correct symbols ***
*** ***
*** In order for this command to work properly, your symbol path ***
*** must point to .pdb files that have full type information. ***
*** ***
*** Certain .pdb files (such as the public OS symbols) do not ***
*** contain the required information. Contact the group that ***
*** provided you with these symbols if you need this command to ***
*** work. ***
*** ***
*** Type referenced: nt!KPRCB ***
*** ***
*************************************************************************
*************************************************************************
*** ***
*** ***
*** Your debugger is not using the correct symbols ***
*** ***
*** In order for this command to work properly, your symbol path ***
*** must point to .pdb files that have full type information. ***
*** ***
*** Certain .pdb files (such as the public OS symbols) do not ***
*** contain the required information. Contact the group that ***
*** provided you with these symbols if you need this command to ***
*** work. ***
*** ***
*** Type referenced: nt!_KPRCB ***
*** ***
*************************************************************************
*************************************************************************
*** ***
*** ***
*** Your debugger is not using the correct symbols ***
*** ***
*** In order for this command to work properly, your symbol path ***
*** must point to .pdb files that have full type information. ***
*** ***
*** Certain .pdb files (such as the public OS symbols) do not ***
*** contain the required information. Contact the group that ***
*** provided you with these symbols if you need this command to ***
*** work. ***
*** ***
*** Type referenced: nt!_KPRCB ***
*** ***
*************************************************************************
*************************************************************************
*** ***
*** ***
*** Your debugger is not using the correct symbols ***
*** ***
*** In order for this command to work properly, your symbol path ***
*** must point to .pdb files that have full type information. ***
*** ***
*** Certain .pdb files (such as the public OS symbols) do not ***
*** contain the required information. Contact the group that ***
*** provided you with these symbols if you need this command to ***
*** work. ***
*** ***
*** Type referenced: nt!_KPRCB ***
*** ***
*************************************************************************
*************************************************************************
*** ***
*** ***
*** Your debugger is not using the correct symbols ***
*** ***
*** In order for this command to work properly, your symbol path ***
*** must point to .pdb files that have full type information. ***
*** ***
*** Certain .pdb files (such as the public OS symbols) do not ***
*** contain the required information. Contact the group that ***
*** provided you with these symbols if you need this command to ***
*** work. ***
*** ***
*** Type referenced: nt!_KPRCB ***
*** ***
*************************************************************************
*********************************************************************
* Symbols can not be loaded because symbol path is not initialized. *
* *
* The Symbol Path can be set by: *
* using the _NT_SYMBOL_PATH environment variable. *
* using the -y <symbol_path> argument when starting the debugger. *
* using .sympath and .sympath+ *
*********************************************************************
*********************************************************************
* Symbols can not be loaded because symbol path is not initialized. *
* *
* The Symbol Path can be set by: *
* using the _NT_SYMBOL_PATH environment variable. *
* using the -y <symbol_path> argument when starting the debugger. *
* using .sympath and .sympath+ *
*********************************************************************
Probably caused by : ntoskrnl.exe ( nt+ef418 )
Followup: MachineOwner
---------