
Corsair One i160 im Test: Der technisch perfekte Gaming-Turm für 4.000 Euro
2/3
Testergebnisse Benchmarks
Die nachfolgenden Benchmarks wurden mit einem vollständig aktualisierten „Windows 10 Version 1809“ vor dem Patchday März 2019 durchgeführt. Als Treiber war der GeForce 419.35 WHQL installiert. Weitere Anpassungen wurden am System nicht vorgenommen. FPS und Frametimes wurden mit OCAT gemessen.
Leistung in Anwendungen
Mit dem auf 95 Watt Verbrauch gedeckelten Core i9-9900K erreicht der Corsair One i160 in Anwendungen genau die Leistung, die zu erwarten war. Im Schnitt fehlen ihm damit 8 Prozent auf einen Core i9-9900K, der immer mit maximalem Turbo operiert, dafür aber auch fast 140 Watt verbraucht. Das Vorjahresmodell mit auf 95 Watt gedeckeltem Core i7-8700K wird im Schnitt über den Parcours um 31 Prozent übertroffen, im Single-Core-Durchlauf im Cinebench R15 sind es hingegen nur 3 Prozent Vorsprung.
-
-
Intel Core i9-9900K100
-
One i160 (9900K, RTX 2080 Ti)92
-
Intel Core i9-9900K (95 Watt LT)92
-
Intel Core i7-9700K84
-
AMD Ryzen 7 2700X81
-
Intel Core i7-8086K LE75
-
Intel Core i7-8700K74
-
Intel Core i7-8700K (95 Watt LT)72
-
One Elite (8700K, GTX 1080 Ti)70
-
AMD Ryzen 7 270070
-
AMD Ryzen 5 2600X66
-
Intel Core i7-8700T65
-
AMD Ryzen 5 260063
-
Intel Core i5-9400F (65 Watt)60
-
Intel Core i5-9400F60
-
Intel Core i5-840059
-
Intel Core i7-7700K55
-
Intel Core i5-8500T50
-
Intel Core i7-8700T (35 Watt LT)49
-
AMD Ryzen 5 2400G43
-
AMD Ryzen 5 140038
-
Intel Core i3-810037
-
AMD Ryzen 3 2200G34
-
AMD Ryzen 3 120029
-
AMD Athlon 200GE @ 4 GHz28
-
AMD Athlon 240GE25
-
Intel Pentium Gold G540025
-
AMD Athlon 220GE24
-
Intel Pentium G456023
-
AMD Athlon 200GE23
-
AMD A10-7890K22
-
AMD A12-9800E20
-
-
integr. Test:
-
Intel Core i9-9900K55.357
-
Intel Core i9-9900K (95 Watt LT)54.484
-
One i160 (9900K, RTX 2080 Ti)54.333
-
AMD Ryzen 7 2700X45.348
-
Intel Core i7-9700K40.599
-
Intel Core i7-8086K LE39.694
-
Intel Core i7-8700K38.653
-
AMD Ryzen 7 270038.607
-
One Elite (8700K, GTX 1080 Ti)38.430
-
Intel Core i7-8700K (95 Watt LT)38.321
-
Intel Core i5-9400F (65 Watt)36.678
-
Intel Core i5-9400F36.612
-
AMD Ryzen 5 2600X36.332
-
Intel Core i7-8700T35.888
-
Intel Core i5-840035.675
-
Intel Core i7-8700T (35 Watt LT)35.584
-
AMD Ryzen 5 260034.783
-
Intel Core i5-8500T32.123
-
Intel Core i7-7700K27.264
-
AMD Ryzen 5 2400G21.664
-
AMD Ryzen 5 140019.842
-
AMD Athlon 200GE @ 4 GHz16.911
-
Intel Core i3-810016.591
-
AMD Ryzen 3 2200G15.665
-
AMD Athlon 240GE15.074
-
AMD Athlon 220GE14.657
-
AMD Athlon 200GE13.983
-
AMD Ryzen 3 120013.289
-
AMD A10-7890K12.228
-
Intel Pentium Gold G540011.699
-
Intel Pentium G456010.890
-
AMD A12-9800E10.504
-
-
x-CPU:
-
Intel Core i9-9900K2.077
-
One i160 (9900K, RTX 2080 Ti)1.924
-
Intel Core i9-9900K (95 Watt LT)1.845
-
AMD Ryzen 7 2700X1.790
-
Intel Core i7-9700K1.542
-
AMD Ryzen 7 27001.526
-
Intel Core i7-8086K LE1.436
-
Intel Core i7-8700K1.423
-
Intel Core i7-8700K (95 Watt LT)1.409
-
One Elite (8700K, GTX 1080 Ti)1.402
-
AMD Ryzen 5 2600X1.373
-
AMD Ryzen 5 26001.307
-
Intel Core i7-8700T1.261
-
Intel Core i5-9400F987
-
Intel Core i5-9400F (65 Watt)987
-
Intel Core i5-8400966
-
Intel Core i7-7700K966
-
Intel Core i7-8700T (35 Watt LT)920
-
AMD Ryzen 5 2400G826
-
Intel Core i5-8500T801
-
AMD Ryzen 5 1400702
-
Intel Core i3-8100598
-
AMD Ryzen 3 2200G576
-
AMD Ryzen 3 1200484
-
AMD Athlon 200GE @ 4 GHz439
-
Intel Pentium Gold G5400401
-
AMD Athlon 240GE395
-
Intel Pentium G4560381
-
AMD Athlon 220GE376
-
AMD Athlon 200GE361
-
AMD A10-7890K341
-
AMD A12-9800E297
-
-
1-CPU:
-
Intel Core i9-9900K218
-
Intel Core i9-9900K (95 Watt LT)217
-
Intel Core i7-8086K LE217
-
Intel Core i7-9700K212
-
One i160 (9900K, RTX 2080 Ti)210
-
Intel Core i7-8700K205
-
Intel Core i7-8700K (95 Watt LT)203
-
Intel Core i7-7700K196
-
One Elite (8700K, GTX 1080 Ti)191
-
Intel Core i5-9400F (65 Watt)179
-
Intel Core i5-9400F177
-
Intel Core i7-8700T176
-
Intel Core i5-8400176
-
AMD Ryzen 7 2700X175
-
Intel Core i7-8700T (35 Watt LT)175
-
AMD Ryzen 5 2600X174
-
AMD Ryzen 5 2600164
-
AMD Ryzen 7 2700163
-
Intel Pentium Gold G5400159
-
AMD Athlon 200GE @ 4 GHz159
-
AMD Ryzen 5 2400G156
-
Intel Core i3-8100156
-
Intel Core i5-8500T153
-
Intel Pentium G4560150
-
AMD Ryzen 3 2200G142
-
AMD Athlon 240GE141
-
AMD Ryzen 5 1400137
-
AMD Ryzen 3 1200136
-
AMD Athlon 220GE133
-
AMD Athlon 200GE127
-
AMD A10-7890K100
-
AMD A12-9800E93
-
-
4K-Video, Umwandlung in H.265 MKV 1080p30:
-
Intel Core i9-9900K2:14
-
One i160 (9900K, RTX 2080 Ti)2:31
-
Intel Core i7-9700K2:33
-
Intel Core i9-9900K (95 Watt LT)2:34
-
AMD Ryzen 7 2700X3:03
-
Intel Core i7-8700K3:07
-
Intel Core i7-8086K LE3:09
-
Intel Core i7-8700K (95 Watt LT)3:14
-
One Elite (8700K, GTX 1080 Ti)3:23
-
AMD Ryzen 7 27003:33
-
Intel Core i7-8700T3:34
-
AMD Ryzen 5 2600X3:51
-
Intel Core i5-9400F (65 Watt)4:01
-
Intel Core i5-9400F4:02
-
AMD Ryzen 5 26004:02
-
Intel Core i5-84004:02
-
Intel Core i7-7700K4:27
-
Intel Core i5-8500T4:51
-
Intel Core i7-8700T (35 Watt LT)5:42
-
Intel Core i3-81006:20
-
AMD Ryzen 5 2400G6:25
-
AMD Ryzen 5 14007:10
-
AMD Ryzen 3 2200G7:47
-
AMD Ryzen 3 12009:13
-
AMD Athlon 200GE @ 4 GHz11:43
-
AMD A10-7890K12:33
-
Intel Pentium Gold G540012:41
-
AMD Athlon 240GE13:10
-
Intel Pentium G456013:19
-
AMD Athlon 220GE13:36
-
AMD Athlon 200GE14:05
-
AMD A12-9800E15:03
-
-
-
Intel Core i9-9900K4.351
-
One i160 (9900K, RTX 2080 Ti)3.850
-
Intel Core i9-9900K (95 Watt LT)3.799
-
Intel Core i7-9700K3.744
-
AMD Ryzen 7 2700X3.664
-
AMD Ryzen 7 27003.152
-
Intel Core i7-8700K3.048
-
Intel Core i7-8086K LE3.013
-
Intel Core i7-8700K (95 Watt LT)2.936
-
One Elite (8700K, GTX 1080 Ti)2.839
-
AMD Ryzen 5 2600X2.821
-
AMD Ryzen 5 26002.682
-
Intel Core i7-8700T2.674
-
Intel Core i5-9400F2.404
-
Intel Core i5-9400F (65 Watt)2.404
-
Intel Core i5-84002.340
-
Intel Core i7-7700K2.073
-
Intel Core i5-8500T1.956
-
AMD Ryzen 5 2400G1.747
-
Intel Core i7-8700T (35 Watt LT)1.724
-
AMD Ryzen 5 14001.515
-
Intel Core i3-81001.489
-
AMD Ryzen 3 2200G1.401
-
AMD Ryzen 3 12001.170
-
AMD Athlon 200GE @ 4 GHz949
-
AMD A10-7890K894
-
Intel Pentium Gold G5400873
-
AMD A12-9800E846
-
AMD Athlon 240GE842
-
Intel Pentium G4560824
-
AMD Athlon 220GE805
-
AMD Athlon 200GE759
-
-
Durchschnitt aus vier Tests:
-
Intel Core i9-9900K38,35
-
One i160 (9900K, RTX 2080 Ti)34,40
-
Intel Core i9-9900K (95 Watt LT)34,19
-
Intel Core i7-9700K33,96
-
AMD Ryzen 7 2700X30,00
-
Intel Core i7-8700K27,96
-
Intel Core i7-8086K LE27,52
-
Intel Core i7-8700K (95 Watt LT)26,72
-
One Elite (8700K, GTX 1080 Ti)25,95
-
AMD Ryzen 7 270025,60
-
AMD Ryzen 5 2600X24,99
-
Intel Core i7-8700T24,49
-
AMD Ryzen 5 260023,73
-
Intel Core i5-9400F (65 Watt)22,54
-
Intel Core i5-9400F22,52
-
Intel Core i5-840021,93
-
Intel Core i7-7700K20,57
-
Intel Core i5-8500T18,11
-
AMD Ryzen 5 2400G15,76
-
Intel Core i7-8700T (35 Watt LT)15,58
-
AMD Ryzen 5 140014,26
-
Intel Core i3-810014,24
-
AMD Ryzen 3 2200G13,17
-
AMD Ryzen 3 120011,09
-
AMD Athlon 200GE @ 4 GHz9,23
-
AMD Athlon 240GE8,18
-
AMD A10-7890K8,10
-
Intel Pentium Gold G54007,92
-
AMD Athlon 220GE7,92
-
Intel Pentium G45607,56
-
AMD Athlon 200GE7,51
-
AMD A12-9800E6,86
-
Leistung in Spielen
Ein vergleichbarer Abstand zwischen den Generationen zeigt sich auch in Spielen: In The Witcher 3 (Ultra HD, maximale Details ohne Hairworks) liegt der Corsair One i160 um 33 und 29 Prozent in den FPS respektive Frametimes vor dem schnellsten Vorjahresmodell.
-
FPS, Durchschnitt:
-
One i160 (9900K, RTX 2080 Ti)69,0
-
One Elite (8700K, GTX 1080 Ti)52,0
-
-
99th Percentile (Frametimes in FPS):
-
One i160 (9900K, RTX 2080 Ti)55,2
-
One Elite (8700K, GTX 1080 Ti)42,7
-
Dass um die 30 Prozent mehr FPS auch in anderen Spielen anliegen würden, zeigt der Vergleich des Corsair One i160 mit GPUs im Standard-Grafikkarten-Testsystem mit Core i7-8700K auf 4,7 GHz: Die Leistung einer GeForce GTX 2080 Ti Founders Edition wird ohne Ausnahme erreicht oder sogar leicht übertroffen. Das verwundert nicht: Unter Dauerlast erreicht die TU102-GPU mit ihrem Budget von 260 Watt Taktraten, wie sie von der Founders Edition mit derselben TDP bekannt sind. Die GPU-Temperatur wird vom Kühlsystem dabei auf 61 Grad gehalten – das ist wenig.
- Performance Rating Ultra HD
- Performance Rating Full HD
- F1 2018 – 1.920 × 1.080
- F1 2018 – 3.840 × 2.160
- Far Cry 5 – 1.920 × 1.080
- Far Cry 5 – 3.840 × 2.160
- Kingdom Come: Deliverance – 1.920 × 1.080
- Kingdom Come: Deliverance – 3.840 × 2.160
- Shadow of the Tomb Raider (DX12) – 1.920 × 1.080
- Shadow of the Tomb Raider (DX12) – 3.840 × 2.160
-
-
One i160 (9900K, RTX 2080 Ti)68
-
Nvidia GeForce RTX 2080 Ti FE66
-
Nvidia GeForce RTX 2080 FE52
-
Nvidia GeForce GTX 1080 Ti FE49
-
AMD Radeon VII48
-
Asus GeForce RTX 2070 Turbo40
-
AMD Radeon RX Vega 6438
-
Nvidia GeForce GTX 1080 FE37
-
AMD Radeon RX Vega 5633
-
Nvidia GeForce GTX 1070 FE30
-
-
-
Nvidia GeForce RTX 2080 Ti FE123
-
One i160 (9900K, RTX 2080 Ti)122
-
Nvidia GeForce RTX 2080 FE110
-
Nvidia GeForce GTX 1080 Ti FE107
-
AMD Radeon VII100
-
Asus GeForce RTX 2070 Turbo93
-
AMD Radeon RX Vega 6489
-
Nvidia GeForce GTX 1080 FE88
-
Nvidia GeForce RTX 2060 FE82
-
AMD Radeon RX Vega 5680
-
Nvidia GeForce GTX 1070 FE73
-
Nvidia GeForce GTX 1660 Ti71
-
AMD Radeon RX 59059
-
AMD Radeon RX 58054
-
MSI GeForce GTX 1060 GDDR5X53
-
Nvidia GeForce GTX 1060 FE52
-
AMD Radeon RX 48051
-
-
FPS, Durchschnitt:
-
One i160 (9900K, RTX 2080 Ti)163,2
-
Nvidia GeForce RTX 2080 Ti FE160,2
-
Nvidia GeForce RTX 2080 FE136,1
-
Nvidia GeForce GTX 1080 Ti FE125,8
-
AMD Radeon VII120,5
-
Asus GeForce RTX 2070 Turbo112,3
-
AMD Radeon RX Vega 64101,5
-
Nvidia GeForce GTX 1080 FE101,2
-
Nvidia GeForce RTX 2060 FE98,5
-
AMD Radeon RX Vega 5692,8
-
Nvidia GeForce GTX 1660 Ti84,4
-
Nvidia GeForce GTX 1070 FE82,8
-
AMD Radeon RX 59067,0
-
AMD Radeon RX 58061,4
-
MSI GeForce GTX 1060 GDDR5X59,1
-
Nvidia GeForce GTX 1060 FE58,5
-
AMD Radeon RX 48056,4
-
-
99th Percentile (Frametimes in FPS):
-
Nvidia GeForce RTX 2080 Ti FE122,0
-
One i160 (9900K, RTX 2080 Ti)114,8
-
Nvidia GeForce RTX 2080 FE105,3
-
Nvidia GeForce GTX 1080 Ti FE95,2
-
AMD Radeon VII93,5
-
Asus GeForce RTX 2070 Turbo86,1
-
AMD Radeon RX Vega 6485,5
-
Nvidia GeForce GTX 1080 FE80,7
-
AMD Radeon RX Vega 5677,5
-
Nvidia GeForce GTX 1070 FE63,1
-
AMD Radeon RX 59052,9
-
AMD Radeon RX 58051,6
-
Nvidia GeForce RTX 2060 FE49,8
-
Nvidia GeForce GTX 1660 Ti48,1
-
AMD Radeon RX 48045,7
-
Nvidia GeForce GTX 1060 FE44,3
-
MSI GeForce GTX 1060 GDDR5X42,4
-
-
FPS, Durchschnitt:
-
One i160 (9900K, RTX 2080 Ti)90,9
-
Nvidia GeForce RTX 2080 Ti FE87,1
-
Nvidia GeForce RTX 2080 FE68,5
-
Nvidia GeForce GTX 1080 Ti FE66,2
-
AMD Radeon VII57,9
-
Asus GeForce RTX 2070 Turbo52,3
-
Nvidia GeForce GTX 1080 FE48,8
-
AMD Radeon RX Vega 6447,8
-
AMD Radeon RX Vega 5641,9
-
Nvidia GeForce GTX 1070 FE39,7
-
-
99th Percentile (Frametimes in FPS):
-
Nvidia GeForce RTX 2080 Ti FE73,5
-
One i160 (9900K, RTX 2080 Ti)70,5
-
Nvidia GeForce RTX 2080 FE61,7
-
Nvidia GeForce GTX 1080 Ti FE56,8
-
AMD Radeon VII49,8
-
Asus GeForce RTX 2070 Turbo42,6
-
AMD Radeon RX Vega 6441,8
-
Nvidia GeForce GTX 1080 FE41,5
-
AMD Radeon RX Vega 5638,0
-
Nvidia GeForce GTX 1070 FE34,0
-
-
FPS, Durchschnitt:
-
Nvidia GeForce RTX 2080 Ti FE131,1
-
Nvidia GeForce GTX 1080 Ti FE127,8
-
Nvidia GeForce RTX 2080 FE127,8
-
One i160 (9900K, RTX 2080 Ti)126,1
-
AMD Radeon VII120,6
-
AMD Radeon RX Vega 64111,5
-
Nvidia GeForce GTX 1080 FE111,3
-
Asus GeForce RTX 2070 Turbo107,5
-
AMD Radeon RX Vega 5698,2
-
Nvidia GeForce RTX 2060 FE97,6
-
Nvidia GeForce GTX 1070 FE92,9
-
Nvidia GeForce GTX 1660 Ti86,4
-
AMD Radeon RX 59070,4
-
MSI GeForce GTX 1060 GDDR5X69,2
-
Nvidia GeForce GTX 1060 FE67,8
-
AMD Radeon RX 58063,4
-
AMD Radeon RX 48059,7
-
-
99th Percentile (Frametimes in FPS):
-
One i160 (9900K, RTX 2080 Ti)97,1
-
Nvidia GeForce GTX 1080 Ti FE96,2
-
Nvidia GeForce RTX 2080 Ti FE95,2
-
AMD Radeon RX Vega 6490,6
-
Nvidia GeForce RTX 2080 FE90,1
-
AMD Radeon VII88,5
-
Nvidia GeForce GTX 1080 FE87,7
-
AMD Radeon RX Vega 5673,5
-
Asus GeForce RTX 2070 Turbo73,5
-
Nvidia GeForce GTX 1070 FE70,4
-
Nvidia GeForce RTX 2060 FE69,0
-
Nvidia GeForce GTX 1660 Ti63,6
-
AMD Radeon RX 59057,1
-
Nvidia GeForce GTX 1060 FE55,0
-
AMD Radeon RX 58053,8
-
MSI GeForce GTX 1060 GDDR5X53,8
-
AMD Radeon RX 48050,0
-
-
FPS, Durchschnitt:
-
One i160 (9900K, RTX 2080 Ti)78,9
-
Nvidia GeForce RTX 2080 Ti FE73,7
-
AMD Radeon VII60,0
-
Nvidia GeForce GTX 1080 Ti FE57,4
-
Nvidia GeForce RTX 2080 FE57,4
-
AMD Radeon RX Vega 6446,2
-
Asus GeForce RTX 2070 Turbo45,0
-
Nvidia GeForce GTX 1080 FE43,7
-
AMD Radeon RX Vega 5640,1
-
Nvidia GeForce GTX 1070 FE35,5
-
-
99th Percentile (Frametimes in FPS):
-
One i160 (9900K, RTX 2080 Ti)63,9
-
Nvidia GeForce RTX 2080 Ti FE59,2
-
Nvidia GeForce GTX 1080 Ti FE50,0
-
AMD Radeon VII47,2
-
Nvidia GeForce RTX 2080 FE46,1
-
AMD Radeon RX Vega 6438,6
-
Nvidia GeForce GTX 1080 FE38,2
-
Asus GeForce RTX 2070 Turbo37,9
-
AMD Radeon RX Vega 5634,0
-
Nvidia GeForce GTX 1070 FE30,0
-
-
FPS, Durchschnitt:
-
Nvidia GeForce RTX 2080 Ti FE93,4
-
One i160 (9900K, RTX 2080 Ti)92,5
-
Nvidia GeForce RTX 2080 FE84,4
-
Nvidia GeForce GTX 1080 Ti FE84,3
-
AMD Radeon VII78,7
-
Asus GeForce RTX 2070 Turbo76,6
-
AMD Radeon RX Vega 6472,6
-
Nvidia GeForce GTX 1080 FE68,4
-
AMD Radeon RX Vega 5666,2
-
Nvidia GeForce RTX 2060 FE65,8
-
Nvidia GeForce GTX 1070 FE56,8
-
Nvidia GeForce GTX 1660 Ti55,2
-
AMD Radeon RX 59048,7
-
AMD Radeon RX 58047,1
-
AMD Radeon RX 48043,3
-
Nvidia GeForce GTX 1060 FE41,6
-
MSI GeForce GTX 1060 GDDR5X40,7
-
-
99th Percentile (Frametimes in FPS):
-
Nvidia GeForce RTX 2080 Ti FE56,2
-
One i160 (9900K, RTX 2080 Ti)55,1
-
AMD Radeon VII53,6
-
AMD Radeon RX Vega 6452,3
-
Nvidia GeForce RTX 2080 FE52,1
-
Nvidia GeForce GTX 1080 Ti FE51,0
-
Asus GeForce RTX 2070 Turbo50,8
-
AMD Radeon RX Vega 5650,0
-
Nvidia GeForce GTX 1080 FE48,3
-
Nvidia GeForce RTX 2060 FE42,7
-
Nvidia GeForce GTX 1070 FE42,2
-
Nvidia GeForce GTX 1660 Ti39,8
-
AMD Radeon RX 59038,6
-
AMD Radeon RX 58036,6
-
AMD Radeon RX 48034,6
-
Nvidia GeForce GTX 1060 FE32,1
-
MSI GeForce GTX 1060 GDDR5X31,7
-
-
FPS, Durchschnitt:
-
One i160 (9900K, RTX 2080 Ti)58,4
-
Nvidia GeForce RTX 2080 Ti FE57,0
-
Nvidia GeForce RTX 2080 FE44,0
-
Nvidia GeForce GTX 1080 Ti FE40,9
-
AMD Radeon VII40,7
-
Asus GeForce RTX 2070 Turbo34,0
-
AMD Radeon RX Vega 6432,1
-
Nvidia GeForce GTX 1080 FE30,0
-
AMD Radeon RX Vega 5629,4
-
Nvidia GeForce GTX 1070 FE24,4
-
-
99th Percentile (Frametimes in FPS):
-
Nvidia GeForce RTX 2080 Ti FE48,8
-
One i160 (9900K, RTX 2080 Ti)46,8
-
Nvidia GeForce RTX 2080 FE38,2
-
AMD Radeon VII37,1
-
Nvidia GeForce GTX 1080 Ti FE36,5
-
AMD Radeon RX Vega 6429,8
-
Asus GeForce RTX 2070 Turbo28,2
-
Nvidia GeForce GTX 1080 FE26,1
-
AMD Radeon RX Vega 5623,6
-
Nvidia GeForce GTX 1070 FE20,8
-
-
FPS, Durchschnitt:
-
Nvidia GeForce RTX 2080 Ti FE116,9
-
One i160 (9900K, RTX 2080 Ti)116,7
-
Nvidia GeForce RTX 2080 FE99,6
-
Nvidia GeForce GTX 1080 Ti FE97,7
-
AMD Radeon VII88,9
-
Asus GeForce RTX 2070 Turbo79,2
-
Nvidia GeForce GTX 1080 FE78,5
-
AMD Radeon RX Vega 6476,3
-
Nvidia GeForce RTX 2060 FE71,4
-
AMD Radeon RX Vega 5666,6
-
Nvidia GeForce GTX 1070 FE63,3
-
Nvidia GeForce GTX 1660 Ti61,9
-
AMD Radeon RX 59052,3
-
AMD Radeon RX 58047,3
-
MSI GeForce GTX 1060 GDDR5X46,2
-
Nvidia GeForce GTX 1060 FE45,6
-
AMD Radeon RX 48045,1
-
-
99th Percentile (Frametimes in FPS):
-
Nvidia GeForce GTX 1080 Ti FE82,0
-
Nvidia GeForce RTX 2080 Ti FE80,7
-
One i160 (9900K, RTX 2080 Ti)74,6
-
Nvidia GeForce RTX 2080 FE70,4
-
Nvidia GeForce GTX 1080 FE68,0
-
AMD Radeon RX Vega 6466,1
-
AMD Radeon VII65,4
-
AMD Radeon RX Vega 5656,8
-
Asus GeForce RTX 2070 Turbo56,8
-
Nvidia GeForce GTX 1070 FE53,2
-
Nvidia GeForce GTX 1660 Ti47,2
-
Nvidia GeForce RTX 2060 FE47,0
-
AMD Radeon RX 59045,5
-
AMD Radeon RX 58041,7
-
Nvidia GeForce GTX 1060 FE41,0
-
MSI GeForce GTX 1060 GDDR5X40,3
-
AMD Radeon RX 48039,2
-
-
FPS, Durchschnitt:
-
One i160 (9900K, RTX 2080 Ti)52,1
-
Nvidia GeForce RTX 2080 Ti FE51,8
-
Nvidia GeForce RTX 2080 FE41,3
-
Nvidia GeForce GTX 1080 Ti FE38,6
-
AMD Radeon VII36,7
-
Asus GeForce RTX 2070 Turbo30,7
-
Nvidia GeForce GTX 1080 FE29,8
-
AMD Radeon RX Vega 6429,5
-
AMD Radeon RX Vega 5624,6
-
Nvidia GeForce GTX 1070 FE22,9
-
-
99th Percentile (Frametimes in FPS):
-
One i160 (9900K, RTX 2080 Ti)46,0
-
Nvidia GeForce RTX 2080 Ti FE45,7
-
Nvidia GeForce RTX 2080 FE35,3
-
Nvidia GeForce GTX 1080 Ti FE34,6
-
AMD Radeon VII32,7
-
Asus GeForce RTX 2070 Turbo27,5
-
AMD Radeon RX Vega 6426,1
-
Nvidia GeForce GTX 1080 FE24,2
-
AMD Radeon RX Vega 5622,3
-
Nvidia GeForce GTX 1070 FE17,9
-
Leistung der Laufwerke
Corsair verbaut in allen drei aktuellen Corsair One eine NVMe-SSD mit einer Anbindung über vier PCIe-Lanes nach Standard 3.0. Im Corsair One i160 ist sie wie im Corsair One i140 offiziell „480 GB“ groß. Corsair bewirbt die mindestens gelieferte unformatierte Kapazität, sie kann je nach gerade verwendeter SSD aber auch größer ausfallen. Zum Einsatz im Testmuster kommt zum Beispiel die Samsung PM961* im M.2-Format mit maximalen Lese- und Schreibraten von 2.800 respektive 1.600 MB/s. Diese Werte werden im CrystalDiskMark 6 beim Lesen übertroffen und beim Schreiben nicht ganz erreicht. Ihre unformatierte Kapazität beträgt 512 GB (formatiert 476 GB).
-
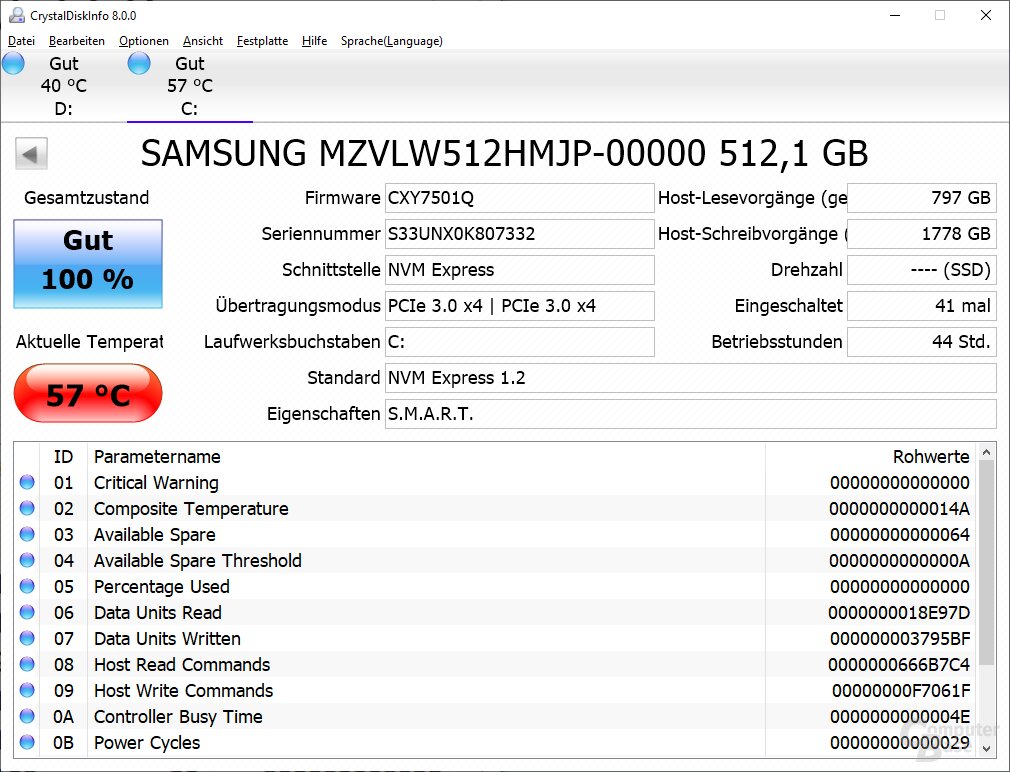 Die SSD im Testsystem ist 512 GB groß

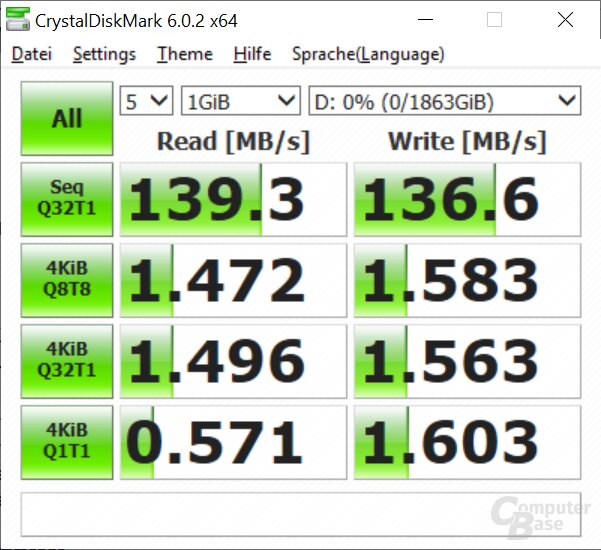
Als HDD wird in allen drei Systemen eine 2 TB große 2,5-Zoll-Festplatte vom Typ Seagate BarraCuda Compute eingesetzt. Sie fällt vor allem durch das extrem geringe Betriebsgeräusch auf: Nur bei Zugriffen kann man sie ganz leise aus dem Rechner heraushören.
-
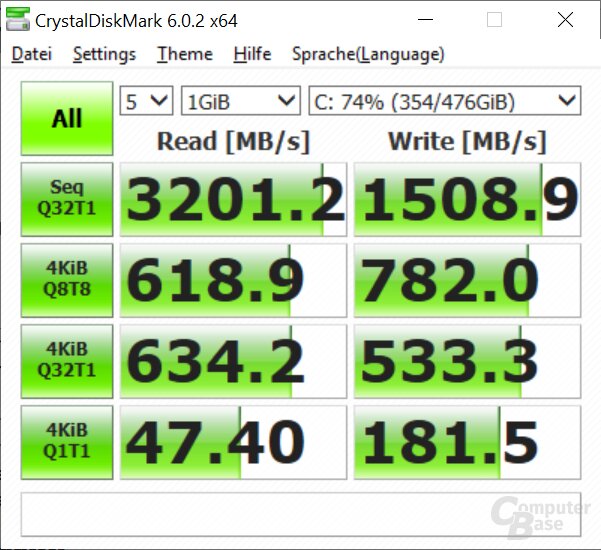 Die Leistung entspricht den Erwartungen
(*) Bei den mit Sternchen markierten Links handelt es sich um Affiliate-Links. Im Fall einer Bestellung über einen solchen Link wird ComputerBase am Verkaufserlös beteiligt, ohne dass der Preis für den Kunden steigt.
