RustyRyan
Newbie
- Registriert
- Feb. 2005
- Beiträge
- 4
Hay CB-Community,
da ich dieses Forum als eines der kompetentesten erachte, erhoffe ich mir Euren allseits beliebten Rat")
Seit ein paar Tagen durfte sich nun - endlich, nach längerer Wartezeit wegen Lieferengpässen - meine neue Hardware gegenseitig vorstellen:
System:
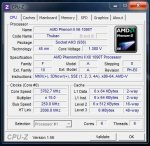
AMD Phenom II X6 1090T @3750MHZ (--> 15 x 250 MHZ, V-Core 1.380V)
Asus Crosshair IV Formula (Northbridge-Takt 2000 MHZ, HT-Link 2000MHZ) BIOS-Vers. 1102
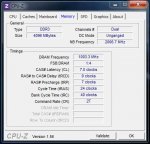
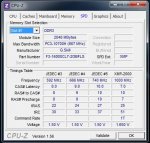
G.Skill Flare F3-16000CL7D-4GBFLS (4GB) @ 1000 MHZ (RAM-Teiler 1:4 --> 4 x 250MHZ) Timings 7-9-7-24 CR2
Geforce GTX480
OCZ Vertex 2 Extendend 60GB SSD
Windows 7 64Bit


Als das System dann endlich stand, lief soweit auch alles einbahnfrei und tadellos.
Seit kurzem allerdings werde ich von mehreren verschiedenen Bluescreens geplagt, welche insbesondere dann auftreten, wenn ich bspw. World of Warcraft "joinen" möchte (habe momentan leider keine anderen Testmöglichkeiten).
Ich gelange ohne jegliche Probleme ins Spiel, innerhalb weniger Sekunden nach Absolvieren des Ladescreens allerdings,
werde ich mit einer WoW-Error-Message aus der Anwendung geschmissen und erhalte meist kurz darauf einen Blue-Screen. Ein weiterer Bluescreen trat dann bei Prime95 auf.
Bei meiner Recherche hier im Forum sind mir ein paar regelrechte "Meister der Bluescreens-Entzauberung" ins Auge gestochen (der Name "Simpel1970" sei da mal so in den virtuellen Raum gestellt).
Ich habe meinen RAM mehrfach mit Memtest86+ durchlaufen lassen. Im DDR1333 Mode absolviert er einbahnfrei mehrere Testdurchläufe ohne einen einzigen Error.
Wenn ich jedoch versuche den RAM im DDR1600 bzw. mit den eigentlich "vorgesehenen" 1000MHZ (also DDR2000) zu betreiben bootet Windows zwar einbahnfrei, auch das Betriebssystem sowie diverse RAM-Datendurchsatz Benchmarks und der RAM-Stresstest von AMD Overdrive laufen flüssig und ohne Probleme durch,
ABER Memtest friert bei Test #5 (ca.21%) komplett ein.
Ich betreibe die Riegel mit den Herstellerspezifikationen 1.65V und den Timings 7-9-7-24. Die Commandrate habe ich dabei auf 2 gesetzt. Die RAM-Spannung hochzusetzen soll ja oftmals helfen, allerdings bin ich diesbzgl. etwas "schissig",
da ich nicht weiss wieviel die Riegel vertragen, bzw. wo das Problem liegen könnte. Nicht dass das Ganze dann in ein explosives Mengegelage auf dem Board mündet:x
Dass die Komponenten (Mainboard + RAM und die oben genannten Einstellungen) ansich (auch mit den Herstellervorgaben von 1.65V) perfekt harmonieren können/sollten lässt sich aus diesem Review von Rabensang erkennen: http://extreme.pcgameshardware.de/l...review-gskill-flare-ddr3-2000-c7-kit-amd.html
Da ich nicht mehr weiter weiss, eröffne ich nun Euer - hoffentlich stattfindendes - Kompetenzgerangel und poste hier die Auswertungen der verschiedenen Mini-Crash-Dumps (ein Danke geht dabei ein Simpel1970 für sein How-To zur Bluescreen-Analyse - hoffe das ist einigermaßen richtig so):
*******************************************************************************
* *
* Bugcheck Analysis *
* *
*******************************************************************************
SYSTEM_SERVICE_EXCEPTION (3b)
An exception happened while executing a system service routine.
Arguments:
Arg1: 00000000c0000005, Exception code that caused the bugcheck
Arg2: fffff8800431dd84, Address of the instruction which caused the bugcheck
Arg3: fffff88008bac480, Address of the context record for the exception that caused the bugcheck
Arg4: 0000000000000000, zero.
Debugging Details:
------------------
EXCEPTION_CODE: (NTSTATUS) 0xc0000005 - Die Anweisung in 0x%08lx verweist auf Speicher 0x%08lx. Der Vorgang %s konnte nicht im Speicher durchgef hrt werden.
FAULTING_IP:
dxgmms1!VIDMM_GLOBAL: iscardAllocationInternal+50
fffff880`0431dd84 488b4810 mov rcx,qword ptr [rax+10h]
CONTEXT: fffff88008bac480 -- (.cxr 0xfffff88008bac480)
rax=00fff8a002c8d7a0 rbx=0000000000000000 rcx=0000000000000000
rdx=fffffa80059b4010 rsi=fffff8a002d31880 rdi=fffffa80059d1000
rip=fffff8800431dd84 rsp=fffff88008bace60 rbp=0000000000000000
r8=fffff8a002d31880 r9=fffff88008bace90 r10=fffff8a002d3e2a0
r11=fffff88008bacdf0 r12=0000000000000000 r13=0000000000000001
r14=fffffa8004c2c690 r15=0000000000000004
iopl=0 nv up ei ng nz na pe nc
cs=0010 ss=0018 ds=002b es=002b fs=0053 gs=002b efl=00010282
dxgmms1!VIDMM_GLOBAL:iscardAllocationInternal+0x50:
fffff880`0431dd84 488b4810 mov rcx,qword ptr [rax+10h] ds:002b:00fff8a0`02c8d7b0=????????????????
Resetting default scope
CUSTOMER_CRASH_COUNT: 1
DEFAULT_BUCKET_ID: VISTA_DRIVER_FAULT
BUGCHECK_STR: 0x3B
PROCESS_NAME: Wow.exe
CURRENT_IRQL: 0
LAST_CONTROL_TRANSFER: from fffff8800432acf0 to fffff8800431dd84
STACK_TEXT:
fffff880`08bace60 fffff880`0432acf0 : 00000000`00000000 fffffa80`059d1000 fffff8a0`02d31880 fffffa80`05732000 : dxgmms1!VIDMM_GLOBAL:iscardAllocationInternal+0x50
fffff880`08bacfe0 00000000`00000000 : 00000000`00000000 00000000`00000000 00000000`00000000 00000000`00000000 : dxgmms1!VIDMM_MEMORY_SEGMENT::EvictResource+0x530
FOLLOWUP_IP:
dxgmms1!VIDMM_GLOBAL:iscardAllocationInternal+50
fffff880`0431dd84 488b4810 mov rcx,qword ptr [rax+10h]
SYMBOL_STACK_INDEX: 0
SYMBOL_NAME: dxgmms1!VIDMM_GLOBAL:iscardAllocationInternal+50
FOLLOWUP_NAME: MachineOwner
MODULE_NAME: dxgmms1
IMAGE_NAME: dxgmms1.sys
DEBUG_FLR_IMAGE_TIMESTAMP: 4a5bc578
STACK_COMMAND: .cxr 0xfffff88008bac480 ; kb
FAILURE_BUCKET_ID: X64_0x3B_dxgmms1!VIDMM_GLOBAL:iscardAllocationInternal+50
BUCKET_ID: X64_0x3B_dxgmms1!VIDMM_GLOBAL:iscardAllocationInternal+50
Followup: MachineOwner
---------------------------------------------------------------------------------
---------------------------------------------------------------------------------
---------------------------------------------------------------------------------
---------------------------------------------------------------------------------
SYSTEM_SERVICE_EXCEPTION (3b)
An exception happened while executing a system service routine.
Arguments:
Arg1: 00000000c0000005, Exception code that caused the bugcheck
Arg2: fffff80002cd17c4, Address of the instruction which caused the bugcheck
Arg3: fffff88003b390f0, Address of the context record for the exception that caused the bugcheck
Arg4: 0000000000000000, zero.
Debugging Details:
------------------
EXCEPTION_CODE: (NTSTATUS) 0xc0000005 - Die Anweisung in 0x%08lx verweist auf Speicher 0x%08lx. Der Vorgang %s konnte nicht im Speicher durchgef hrt werden.
FAULTING_IP:
nt!KiDeferredReadyThread+e4
fffff800`02cd17c4 80bd1e04000002 cmp byte ptr [rbp+41Eh],2
CONTEXT: fffff88003b390f0 -- (.cxr 0xfffff88003b390f0)
rax=00000000000000e0 rbx=0000000000000004 rcx=0000000000000008
rdx=0000000000000009 rsi=0000000000000001 rdi=fffffa8004ca3b60
rip=fffff80002cd17c4 rsp=fffff88003b39ad0 rbp=00fffa8004b4e330
r8=0000000000000008 r9=fffffa80055af210 r10=fffff80002c5b000
r11=00000000001f0003 r12=0000000000000001 r13=0000000001f5eaa1
r14=8000000000000200 r15=00000000000000b4
iopl=0 nv up ei pl nz na po nc
cs=0010 ss=0018 ds=002b es=002b fs=0053 gs=002b efl=00010206
nt!KiDeferredReadyThread+0xe4:
fffff800`02cd17c4 80bd1e04000002 cmp byte ptr [rbp+41Eh],2 ss:0018:00fffa80`04b4e74e=??
Resetting default scope
CUSTOMER_CRASH_COUNT: 1
DEFAULT_BUCKET_ID: VISTA_DRIVER_FAULT
BUGCHECK_STR: 0x3B
PROCESS_NAME: SearchIndexer.
CURRENT_IRQL: 2
LAST_CONTROL_TRANSFER: from fffff80002cd1071 to fffff80002cd17c4
STACK_TEXT:
fffff880`03b39ad0 fffff800`02cd1071 : fffffa80`05dea060 00000000`00000000 00000000`00000000 00000000`00000001 : nt!KiDeferredReadyThread+0xe4
fffff880`03b39b50 fffff800`02fe6df0 : 00000000`00000000 fffff800`00000001 fffffa80`039e9500 fffffa80`04ca3c68 : nt!KeSetEvent+0x1e1
fffff880`03b39bc0 fffff800`02ccc153 : fffffa80`05dea060 fffff880`03b39ca0 00000000`00000000 fffffa80`039e5b00 : nt!NtSetEvent+0x90
fffff880`03b39c20 00000000`770eff9a : 00000000`00000000 00000000`00000000 00000000`00000000 00000000`00000000 : nt!KiSystemServiceCopyEnd+0x13
00000000`0466e1e8 00000000`00000000 : 00000000`00000000 00000000`00000000 00000000`00000000 00000000`00000000 : 0x770eff9a
FOLLOWUP_IP:
nt!KiDeferredReadyThread+e4
fffff800`02cd17c4 80bd1e04000002 cmp byte ptr [rbp+41Eh],2
SYMBOL_STACK_INDEX: 0
SYMBOL_NAME: nt!KiDeferredReadyThread+e4
FOLLOWUP_NAME: MachineOwner
MODULE_NAME: nt
IMAGE_NAME: ntkrnlmp.exe
DEBUG_FLR_IMAGE_TIMESTAMP: 4a5bc600
STACK_COMMAND: .cxr 0xfffff88003b390f0 ; kb
FAILURE_BUCKET_ID: X64_0x3B_nt!KiDeferredReadyThread+e4
BUCKET_ID: X64_0x3B_nt!KiDeferredReadyThread+e4
Followup: MachineOwner
--------------------------------------------------------------------------------------
--------------------------------------------------------------------------------------
--------------------------------------------------------------------------------------
--------------------------------------------------------------------------------------
KMODE_EXCEPTION_NOT_HANDLED (1e)
This is a very common bugcheck. Usually the exception address pinpoints
the driver/function that caused the problem. Always note this address
as well as the link date of the driver/image that contains this address.
Arguments:
Arg1: ffffffffc0000096, The exception code that was not handled
Arg2: fffff80002cb3cc4, The address that the exception occurred at
Arg3: 0000000000000000, Parameter 0 of the exception
Arg4: ffffffffffffff00, Parameter 1 of the exception
Debugging Details:
------------------
EXCEPTION_CODE: (NTSTATUS) 0xc0000096 - {AUSNAHME} Privilegierte Anweisung
FAULTING_IP:
nt!KiApcInterrupt+b4
fffff800`02cb3cc4 440f22c1 mov cr8,rcx
EXCEPTION_PARAMETER1: 0000000000000000
EXCEPTION_PARAMETER2: ffffffffffffff00
ERROR_CODE: (NTSTATUS) 0xc0000096 - {AUSNAHME} Privilegierte Anweisung
BUGCHECK_STR: 0x1E_c0000096
CUSTOMER_CRASH_COUNT: 1
DEFAULT_BUCKET_ID: VISTA_DRIVER_FAULT
PROCESS_NAME: avwsc.exe
CURRENT_IRQL: 0
LAST_CONTROL_TRANSFER: from fffff80002d16a17 to fffff80002cd6f00
STACK_TEXT:
fffff880`07aafed8 fffff800`02d16a17 : 00000000`0000001e ffffffff`c0000096 fffff800`02cb3cc4 00000000`00000000 : nt!KeBugCheckEx
fffff880`07aafee0 fffff800`02cd6542 : fffff880`07ab06b8 fffff880`009b1180 fffff880`07ab0760 00000000`00000000 : nt! ?? ::FNODOBFM::`string'+0x460da
fffff880`07ab0580 fffff800`02cd469f : fffff880`07ab0760 fffffa80`03c55500 fffff880`00000000 fffffa80`00000000 : nt!KiExceptionDispatch+0xc2
fffff880`07ab0760 fffff800`02cb3cc4 : fffff880`0284d730 fffffa80`04aeb180 fffff880`0284d704 fffff8a0`010f6140 : nt!KiInvalidOpcodeFault+0x11f
fffff880`07ab08f0 fffff800`02fa2053 : fffff880`07ab0a78 00000000`00000000 00000000`00000202 fffff800`02cdd297 : nt!KiApcInterrupt+0xb4
fffff880`07ab0a80 fffff800`02cb55b5 : fffff880`009b1180 00000000`00000000 fffff800`02fa2040 00000000`00000000 : nt!PspUserThreadStartup+0x13
fffff880`07ab0ae0 fffff800`02cb5537 : 00000000`00000000 00000000`00000000 00000000`00000000 00000000`00000000 : nt!KiStartUserThread+0x16
fffff880`07ab0c20 00000000`77343260 : 00000000`00000000 00000000`00000000 00000000`00000000 00000000`00000000 : nt!KiStartUserThreadReturn
00000000`0158fcf8 00000000`00000000 : 00000000`00000000 00000000`00000000 00000000`00000000 00000000`00000000 : 0x77343260
STACK_COMMAND: kb
FOLLOWUP_IP:
nt!KiApcInterrupt+b4
fffff800`02cb3cc4 440f22c1 mov cr8,rcx
SYMBOL_STACK_INDEX: 4
SYMBOL_NAME: nt!KiApcInterrupt+b4
FOLLOWUP_NAME: MachineOwner
MODULE_NAME: nt
IMAGE_NAME: ntkrnlmp.exe
DEBUG_FLR_IMAGE_TIMESTAMP: 4a5bc600
FAILURE_BUCKET_ID: X64_0x1E_c0000096_nt!KiApcInterrupt+b4
BUCKET_ID: X64_0x1E_c0000096_nt!KiApcInterrupt+b4
Followup: MachineOwner
----------------------------------------------------------------------------------
----------------------------------------------------------------------------------
----------------------------------------------------------------------------------
Tausend Dank an Euch!")
da ich dieses Forum als eines der kompetentesten erachte, erhoffe ich mir Euren allseits beliebten Rat
Seit ein paar Tagen durfte sich nun - endlich, nach längerer Wartezeit wegen Lieferengpässen - meine neue Hardware gegenseitig vorstellen:
System:
AMD Phenom II X6 1090T @3750MHZ (--> 15 x 250 MHZ, V-Core 1.380V)
Asus Crosshair IV Formula (Northbridge-Takt 2000 MHZ, HT-Link 2000MHZ) BIOS-Vers. 1102
G.Skill Flare F3-16000CL7D-4GBFLS (4GB) @ 1000 MHZ (RAM-Teiler 1:4 --> 4 x 250MHZ) Timings 7-9-7-24 CR2
Geforce GTX480
OCZ Vertex 2 Extendend 60GB SSD
Windows 7 64Bit
Als das System dann endlich stand, lief soweit auch alles einbahnfrei und tadellos.
Seit kurzem allerdings werde ich von mehreren verschiedenen Bluescreens geplagt, welche insbesondere dann auftreten, wenn ich bspw. World of Warcraft "joinen" möchte (habe momentan leider keine anderen Testmöglichkeiten).
Ich gelange ohne jegliche Probleme ins Spiel, innerhalb weniger Sekunden nach Absolvieren des Ladescreens allerdings,
werde ich mit einer WoW-Error-Message aus der Anwendung geschmissen und erhalte meist kurz darauf einen Blue-Screen. Ein weiterer Bluescreen trat dann bei Prime95 auf.
Bei meiner Recherche hier im Forum sind mir ein paar regelrechte "Meister der Bluescreens-Entzauberung" ins Auge gestochen (der Name "Simpel1970" sei da mal so in den virtuellen Raum gestellt).
Ich habe meinen RAM mehrfach mit Memtest86+ durchlaufen lassen. Im DDR1333 Mode absolviert er einbahnfrei mehrere Testdurchläufe ohne einen einzigen Error.
Wenn ich jedoch versuche den RAM im DDR1600 bzw. mit den eigentlich "vorgesehenen" 1000MHZ (also DDR2000) zu betreiben bootet Windows zwar einbahnfrei, auch das Betriebssystem sowie diverse RAM-Datendurchsatz Benchmarks und der RAM-Stresstest von AMD Overdrive laufen flüssig und ohne Probleme durch,
ABER Memtest friert bei Test #5 (ca.21%) komplett ein.
Ich betreibe die Riegel mit den Herstellerspezifikationen 1.65V und den Timings 7-9-7-24. Die Commandrate habe ich dabei auf 2 gesetzt. Die RAM-Spannung hochzusetzen soll ja oftmals helfen, allerdings bin ich diesbzgl. etwas "schissig",
da ich nicht weiss wieviel die Riegel vertragen, bzw. wo das Problem liegen könnte. Nicht dass das Ganze dann in ein explosives Mengegelage auf dem Board mündet:x
Dass die Komponenten (Mainboard + RAM und die oben genannten Einstellungen) ansich (auch mit den Herstellervorgaben von 1.65V) perfekt harmonieren können/sollten lässt sich aus diesem Review von Rabensang erkennen: http://extreme.pcgameshardware.de/l...review-gskill-flare-ddr3-2000-c7-kit-amd.html
Da ich nicht mehr weiter weiss, eröffne ich nun Euer - hoffentlich stattfindendes - Kompetenzgerangel und poste hier die Auswertungen der verschiedenen Mini-Crash-Dumps (ein Danke geht dabei ein Simpel1970 für sein How-To zur Bluescreen-Analyse - hoffe das ist einigermaßen richtig so):
*******************************************************************************
* *
* Bugcheck Analysis *
* *
*******************************************************************************
SYSTEM_SERVICE_EXCEPTION (3b)
An exception happened while executing a system service routine.
Arguments:
Arg1: 00000000c0000005, Exception code that caused the bugcheck
Arg2: fffff8800431dd84, Address of the instruction which caused the bugcheck
Arg3: fffff88008bac480, Address of the context record for the exception that caused the bugcheck
Arg4: 0000000000000000, zero.
Debugging Details:
------------------
EXCEPTION_CODE: (NTSTATUS) 0xc0000005 - Die Anweisung in 0x%08lx verweist auf Speicher 0x%08lx. Der Vorgang %s konnte nicht im Speicher durchgef hrt werden.
FAULTING_IP:
dxgmms1!VIDMM_GLOBAL:
fffff880`0431dd84 488b4810 mov rcx,qword ptr [rax+10h]
CONTEXT: fffff88008bac480 -- (.cxr 0xfffff88008bac480)
rax=00fff8a002c8d7a0 rbx=0000000000000000 rcx=0000000000000000
rdx=fffffa80059b4010 rsi=fffff8a002d31880 rdi=fffffa80059d1000
rip=fffff8800431dd84 rsp=fffff88008bace60 rbp=0000000000000000
r8=fffff8a002d31880 r9=fffff88008bace90 r10=fffff8a002d3e2a0
r11=fffff88008bacdf0 r12=0000000000000000 r13=0000000000000001
r14=fffffa8004c2c690 r15=0000000000000004
iopl=0 nv up ei ng nz na pe nc
cs=0010 ss=0018 ds=002b es=002b fs=0053 gs=002b efl=00010282
dxgmms1!VIDMM_GLOBAL:
fffff880`0431dd84 488b4810 mov rcx,qword ptr [rax+10h] ds:002b:00fff8a0`02c8d7b0=????????????????
Resetting default scope
CUSTOMER_CRASH_COUNT: 1
DEFAULT_BUCKET_ID: VISTA_DRIVER_FAULT
BUGCHECK_STR: 0x3B
PROCESS_NAME: Wow.exe
CURRENT_IRQL: 0
LAST_CONTROL_TRANSFER: from fffff8800432acf0 to fffff8800431dd84
STACK_TEXT:
fffff880`08bace60 fffff880`0432acf0 : 00000000`00000000 fffffa80`059d1000 fffff8a0`02d31880 fffffa80`05732000 : dxgmms1!VIDMM_GLOBAL:
fffff880`08bacfe0 00000000`00000000 : 00000000`00000000 00000000`00000000 00000000`00000000 00000000`00000000 : dxgmms1!VIDMM_MEMORY_SEGMENT::EvictResource+0x530
FOLLOWUP_IP:
dxgmms1!VIDMM_GLOBAL:
fffff880`0431dd84 488b4810 mov rcx,qword ptr [rax+10h]
SYMBOL_STACK_INDEX: 0
SYMBOL_NAME: dxgmms1!VIDMM_GLOBAL:
FOLLOWUP_NAME: MachineOwner
MODULE_NAME: dxgmms1
IMAGE_NAME: dxgmms1.sys
DEBUG_FLR_IMAGE_TIMESTAMP: 4a5bc578
STACK_COMMAND: .cxr 0xfffff88008bac480 ; kb
FAILURE_BUCKET_ID: X64_0x3B_dxgmms1!VIDMM_GLOBAL:
BUCKET_ID: X64_0x3B_dxgmms1!VIDMM_GLOBAL:
Followup: MachineOwner
---------------------------------------------------------------------------------
---------------------------------------------------------------------------------
---------------------------------------------------------------------------------
---------------------------------------------------------------------------------
SYSTEM_SERVICE_EXCEPTION (3b)
An exception happened while executing a system service routine.
Arguments:
Arg1: 00000000c0000005, Exception code that caused the bugcheck
Arg2: fffff80002cd17c4, Address of the instruction which caused the bugcheck
Arg3: fffff88003b390f0, Address of the context record for the exception that caused the bugcheck
Arg4: 0000000000000000, zero.
Debugging Details:
------------------
EXCEPTION_CODE: (NTSTATUS) 0xc0000005 - Die Anweisung in 0x%08lx verweist auf Speicher 0x%08lx. Der Vorgang %s konnte nicht im Speicher durchgef hrt werden.
FAULTING_IP:
nt!KiDeferredReadyThread+e4
fffff800`02cd17c4 80bd1e04000002 cmp byte ptr [rbp+41Eh],2
CONTEXT: fffff88003b390f0 -- (.cxr 0xfffff88003b390f0)
rax=00000000000000e0 rbx=0000000000000004 rcx=0000000000000008
rdx=0000000000000009 rsi=0000000000000001 rdi=fffffa8004ca3b60
rip=fffff80002cd17c4 rsp=fffff88003b39ad0 rbp=00fffa8004b4e330
r8=0000000000000008 r9=fffffa80055af210 r10=fffff80002c5b000
r11=00000000001f0003 r12=0000000000000001 r13=0000000001f5eaa1
r14=8000000000000200 r15=00000000000000b4
iopl=0 nv up ei pl nz na po nc
cs=0010 ss=0018 ds=002b es=002b fs=0053 gs=002b efl=00010206
nt!KiDeferredReadyThread+0xe4:
fffff800`02cd17c4 80bd1e04000002 cmp byte ptr [rbp+41Eh],2 ss:0018:00fffa80`04b4e74e=??
Resetting default scope
CUSTOMER_CRASH_COUNT: 1
DEFAULT_BUCKET_ID: VISTA_DRIVER_FAULT
BUGCHECK_STR: 0x3B
PROCESS_NAME: SearchIndexer.
CURRENT_IRQL: 2
LAST_CONTROL_TRANSFER: from fffff80002cd1071 to fffff80002cd17c4
STACK_TEXT:
fffff880`03b39ad0 fffff800`02cd1071 : fffffa80`05dea060 00000000`00000000 00000000`00000000 00000000`00000001 : nt!KiDeferredReadyThread+0xe4
fffff880`03b39b50 fffff800`02fe6df0 : 00000000`00000000 fffff800`00000001 fffffa80`039e9500 fffffa80`04ca3c68 : nt!KeSetEvent+0x1e1
fffff880`03b39bc0 fffff800`02ccc153 : fffffa80`05dea060 fffff880`03b39ca0 00000000`00000000 fffffa80`039e5b00 : nt!NtSetEvent+0x90
fffff880`03b39c20 00000000`770eff9a : 00000000`00000000 00000000`00000000 00000000`00000000 00000000`00000000 : nt!KiSystemServiceCopyEnd+0x13
00000000`0466e1e8 00000000`00000000 : 00000000`00000000 00000000`00000000 00000000`00000000 00000000`00000000 : 0x770eff9a
FOLLOWUP_IP:
nt!KiDeferredReadyThread+e4
fffff800`02cd17c4 80bd1e04000002 cmp byte ptr [rbp+41Eh],2
SYMBOL_STACK_INDEX: 0
SYMBOL_NAME: nt!KiDeferredReadyThread+e4
FOLLOWUP_NAME: MachineOwner
MODULE_NAME: nt
IMAGE_NAME: ntkrnlmp.exe
DEBUG_FLR_IMAGE_TIMESTAMP: 4a5bc600
STACK_COMMAND: .cxr 0xfffff88003b390f0 ; kb
FAILURE_BUCKET_ID: X64_0x3B_nt!KiDeferredReadyThread+e4
BUCKET_ID: X64_0x3B_nt!KiDeferredReadyThread+e4
Followup: MachineOwner
--------------------------------------------------------------------------------------
--------------------------------------------------------------------------------------
--------------------------------------------------------------------------------------
--------------------------------------------------------------------------------------
KMODE_EXCEPTION_NOT_HANDLED (1e)
This is a very common bugcheck. Usually the exception address pinpoints
the driver/function that caused the problem. Always note this address
as well as the link date of the driver/image that contains this address.
Arguments:
Arg1: ffffffffc0000096, The exception code that was not handled
Arg2: fffff80002cb3cc4, The address that the exception occurred at
Arg3: 0000000000000000, Parameter 0 of the exception
Arg4: ffffffffffffff00, Parameter 1 of the exception
Debugging Details:
------------------
EXCEPTION_CODE: (NTSTATUS) 0xc0000096 - {AUSNAHME} Privilegierte Anweisung
FAULTING_IP:
nt!KiApcInterrupt+b4
fffff800`02cb3cc4 440f22c1 mov cr8,rcx
EXCEPTION_PARAMETER1: 0000000000000000
EXCEPTION_PARAMETER2: ffffffffffffff00
ERROR_CODE: (NTSTATUS) 0xc0000096 - {AUSNAHME} Privilegierte Anweisung
BUGCHECK_STR: 0x1E_c0000096
CUSTOMER_CRASH_COUNT: 1
DEFAULT_BUCKET_ID: VISTA_DRIVER_FAULT
PROCESS_NAME: avwsc.exe
CURRENT_IRQL: 0
LAST_CONTROL_TRANSFER: from fffff80002d16a17 to fffff80002cd6f00
STACK_TEXT:
fffff880`07aafed8 fffff800`02d16a17 : 00000000`0000001e ffffffff`c0000096 fffff800`02cb3cc4 00000000`00000000 : nt!KeBugCheckEx
fffff880`07aafee0 fffff800`02cd6542 : fffff880`07ab06b8 fffff880`009b1180 fffff880`07ab0760 00000000`00000000 : nt! ?? ::FNODOBFM::`string'+0x460da
fffff880`07ab0580 fffff800`02cd469f : fffff880`07ab0760 fffffa80`03c55500 fffff880`00000000 fffffa80`00000000 : nt!KiExceptionDispatch+0xc2
fffff880`07ab0760 fffff800`02cb3cc4 : fffff880`0284d730 fffffa80`04aeb180 fffff880`0284d704 fffff8a0`010f6140 : nt!KiInvalidOpcodeFault+0x11f
fffff880`07ab08f0 fffff800`02fa2053 : fffff880`07ab0a78 00000000`00000000 00000000`00000202 fffff800`02cdd297 : nt!KiApcInterrupt+0xb4
fffff880`07ab0a80 fffff800`02cb55b5 : fffff880`009b1180 00000000`00000000 fffff800`02fa2040 00000000`00000000 : nt!PspUserThreadStartup+0x13
fffff880`07ab0ae0 fffff800`02cb5537 : 00000000`00000000 00000000`00000000 00000000`00000000 00000000`00000000 : nt!KiStartUserThread+0x16
fffff880`07ab0c20 00000000`77343260 : 00000000`00000000 00000000`00000000 00000000`00000000 00000000`00000000 : nt!KiStartUserThreadReturn
00000000`0158fcf8 00000000`00000000 : 00000000`00000000 00000000`00000000 00000000`00000000 00000000`00000000 : 0x77343260
STACK_COMMAND: kb
FOLLOWUP_IP:
nt!KiApcInterrupt+b4
fffff800`02cb3cc4 440f22c1 mov cr8,rcx
SYMBOL_STACK_INDEX: 4
SYMBOL_NAME: nt!KiApcInterrupt+b4
FOLLOWUP_NAME: MachineOwner
MODULE_NAME: nt
IMAGE_NAME: ntkrnlmp.exe
DEBUG_FLR_IMAGE_TIMESTAMP: 4a5bc600
FAILURE_BUCKET_ID: X64_0x1E_c0000096_nt!KiApcInterrupt+b4
BUCKET_ID: X64_0x1E_c0000096_nt!KiApcInterrupt+b4
Followup: MachineOwner
----------------------------------------------------------------------------------
----------------------------------------------------------------------------------
----------------------------------------------------------------------------------
Tausend Dank an Euch!