Razer Blade 15 (2018) im Test: Extremes Notebook mit Max-Q, auch bei der CPU
2/3Leistung Anwendungen
Mit dem Handicap von 10 Watt auf den Verbrauch kann sich der Sechskern-Prozessor Core i7-8750H im Razer Blade 15 nicht von den schnellsten und ungedrosselten mobilen Vierkern-CPUs der letzten Generation absetzen. Der unter Dauerlast nur auf 45 Watt gebremste Core i7-8750H ist um ca. 30 Prozent schneller.
-
Multi-Core-Test:
-
Intel Core i7-8750H1.144
-
Intel Core i7-8750H (Razer)858
-
Intel Core i7-8809G (NUC)840
-
Intel Core i7-7820HK OC822
-
Intel Core i7-7820HK767
-
Intel Core i7-6920HQ739
-
Intel Core i7-7700HQ728
-
Intel Core i7-6700HQ642
-
Intel Core i7-6600U309
-
Intel Core i5-6300U302
-
Intel Core i5-6200U281
-
Intel Core m6-6Y54240
-
Intel Core i5-4300U235
-
Intel Core m5-6Y54228
-
Intel Core m3-6Y30209
-
Intel Core m5-6Y57173
-
-
Single-Core-Test:
-
Intel Core i7-8809G (NUC)179
-
Intel Core i7-8750H173
-
Intel Core i7-8750H (Razer)171
-
Intel Core i7-7820HK OC167
-
Intel Core i7-7820HK160
-
Intel Core i7-6920HQ155
-
Intel Core i7-7700HQ146
-
Intel Core i7-6600U138
-
Intel Core i7-6700HQ136
-
Intel Core i5-6300U121
-
Intel Core i5-6200U113
-
Intel Core i5-4300U103
-
Intel Core m6-6Y5494
-
Intel Core m5-6Y5493
-
Intel Core m3-6Y3089
-
Intel Core m5-6Y5773
-
-
Multi-Core-Test:
-
Intel Core i7-8750H1.144
-
Intel Core i7-8750H (Razer)858
-
Intel Core i7-8809G (NUC)840
-
Apple MacBook Pro 15" (Core i7-6920HQ)739
-
Dell XPS 13 (9370) (Core i7-8550U)715
-
Microsoft Surface Book 2 13" (Core i7-8650U)684
-
Medion X7843 (Core i7-6700HQ)677
-
Microsoft Surface Book 2 15" (Core i7-8650U)647
-
Acer Swift 3 (Ryzen 5 2500U)596
-
Medion P7651 (Core i7-8550U)570
-
Acer Spin 5 (Core i5-8250U)555
-
Lenovo IdeaPad 720S (Ryzen 7 2700U)485
-
Microsoft Surface Pro (Core i7-7660U)410
-
Apple MacBook Pro 13" (Core i5-7267U)381
-
Apple MacBook Pro 13" (Core i5-6267U)334
-
Lenovo Miix 720 (Core i7-7500U)333
-
Microsoft Surface Laptop (Core i5-7200U)324
-
Huawei MateBook X (Core i5-7200U)318
-
Apple MacBook Pro 13" (Core i5-6360U)318
-
Dell XPS 13 (9360) (Core i5-7200U)317
-
Microsoft Surface Book (Core i7-6600U)309
-
Microsoft Surface Pro 4 (Core i5-6300U)302
-
Tuxedo Book (Core i7-7500U)301
-
Acer Switch Alpha 12 (Core i5-6200U)281
-
Lenovo X1 Tablet (Core m5-6Y54)240
-
Huawei MateBook (Core m5-6Y54)228
-
Acer Spin 7 (Core i7-7Y75)217
-
Microsoft Surface Pro 4 (Core m3-6Y30)212
-
Samsung Galaxy TabPro S (Core m3-6Y30)209
-
Dell Latitude 7370 (Core m5-6Y57)173
-
Das gilt nicht nur für Cinebench R15, sondern auch für andere Programme wie POV-Ray oder den x265 HD Benchmark. Der immer mit maximalem Turbotakt agierende Vierkern-Prozessor Intel Core i7-8809G („Kaby Lake-G“) erreicht jeweils ein etwas besseres Resultat.
-
-
Intel Core i7-8750H2.144
-
Intel Core i7-8809G (NUC)1.819
-
Intel Core i7-8750H (Razer)1.692
-
Dell XPS 13 (9370) (Core i7-8550U)1.388
-
Microsoft Surface Book 2 15" (Core i7-8650U)1.299
-
Acer Swift 3 (Ryzen 5 2500U)1.208
-
Microsoft Surface Book 2 13" (Core i7-8650U)1.138
-
Acer Spin 5 (Core i5-8250U)1.108
-
Medion P7651 (Core i7-8550U)1.098
-
Lenovo IdeaPad 720S (Ryzen 7 2700U)695
-
Dell XPS 13 (9360) (Core i5-7200U)683
-
-
-
Intel Core i7-8750H20,56
-
Intel Core i7-8809G (NUC)17,90
-
Intel Core i7-8750H (Razer)17,60
-
Dell XPS 13 (9370) (Core i7-8550U)14,01
-
Microsoft Surface Book 2 13" (Core i7-8650U)12,75
-
Microsoft Surface Book 2 15" (Core i7-8650U)12,28
-
Acer Swift 3 (Ryzen 5 2500U)11,59
-
Medion P7651 (Core i7-8550U)10,90
-
Acer Spin 5 (Core i5-8250U)10,60
-
Dell XPS 13 (9360) (Core i5-7200U)6,83
-
Leistung Spiele
Mit der GeForce GTX 1070 Max-Q und dem Core i7-8750H platziert sich das Notebook im Durchschnitt über die getesteten AAA-Spiele genau zwischen GeForce GTX 1060 und GeForce GTX 1070 für den Desktop-PC (jeweils Founders Edition). Die 14 Prozent Rückstand auf die GeForce GTX 1070 Founders Edition passen dabei gut in das von Nvidia vorgegebene Korsett: Die mobile GeForce GTX 1070 darf maximal zehn Prozent, die Max-Q wiederum nochmals maximal 10 Prozent langsamer sein. 14 Prozent Rückstand liegen damit klar im grünen Bereich.
- Leistungsrating AAA-Spiele
- Assassin's Creed Origins – 1.920 × 1.080
- Ghost Recon Wildlands – 1.920 × 1.080
- Overwatch – 1.920 × 1.080
- The Witcher 3 – 1.920 × 1.080
- Wolfenstein 2 – 1.920 × 1.080
-
-
Asus GeForce GTX 1080 Ti Strix120
-
Nvidia GeForce GTX 1080 Ti111
-
MSI GeForce GTX 1080 Gaming X94
-
Asus Radeon RX Vega 64 Strix92
-
AMD Radeon RX Vega 6490
-
Nvidia GeForce GTX 108089
-
Nvidia GeForce GTX 1070 Ti86
-
PowerColor RX Vega 56 Red Devil85
-
AMD Radeon RX Vega 5682
-
Asus GeForce GTX 1070 Strix81
-
Nvidia GeForce GTX 107075
-
Razer Blade 15 (GTX 1070 Max-Q)64
-
Sapphire Radeon RX 580 Nitro+60
-
Asus GeForce GTX 1060 Strix59
-
AMD Radeon RX 58058
-
Nvidia GeForce GTX 106055
-
AMD Radeon RX 57051
-
AMD Radeon R9 Fury X50
-
AMD Radeon R9 39047
-
Nvidia GeForce GTX 97045
-
AMD Radeon R9 38033
-
Nvidia GeForce GTX 1050 Ti32
-
Nvidia GeForce GTX 96031
-
AMD Radeon RX 56027
-
-
FPS, Durchschnitt:
-
Asus GeForce GTX 1080 Ti Strix102,8
-
Nvidia GeForce GTX 1080 Ti93,3
-
MSI GeForce GTX 1080 Gaming X85,5
-
Nvidia GeForce GTX 108079,9
-
Asus Radeon RX Vega 64 Strix76,1
-
AMD Radeon RX Vega 6474,8
-
Asus GeForce GTX 1070 Strix74,4
-
Nvidia GeForce GTX 1070 Ti74,2
-
PowerColor RX Vega 56 Red Devil70,7
-
AMD Radeon RX Vega 5669,0
-
Nvidia GeForce GTX 107068,7
-
Asus GeForce GTX 1060 Strix57,2
-
Razer Blade 15 (GTX 1070 Max-Q)54,2
-
Nvidia GeForce GTX 106052,3
-
Sapphire Radeon RX 580 Nitro+49,9
-
AMD Radeon RX 58048,7
-
AMD Radeon R9 Fury X46,8
-
AMD Radeon RX 57046,7
-
Nvidia GeForce GTX 97046,1
-
AMD Radeon R9 39036,7
-
Nvidia GeForce GTX 1050 Ti33,5
-
Nvidia GeForce GTX 96032,8
-
AMD Radeon R9 38030,5
-
AMD Radeon RX 56027,3
-
-
99th Percentile (Frametimes in FPS):
-
Asus GeForce GTX 1080 Ti Strix74,1
-
Nvidia GeForce GTX 1080 Ti72,5
-
MSI GeForce GTX 1080 Gaming X69,3
-
Nvidia GeForce GTX 108068,5
-
Nvidia GeForce GTX 1070 Ti64,5
-
Asus GeForce GTX 1070 Strix58,1
-
Asus Radeon RX Vega 64 Strix56,8
-
Nvidia GeForce GTX 107055,7
-
AMD Radeon RX Vega 6455,6
-
Razer Blade 15 (GTX 1070 Max-Q)54,2
-
PowerColor RX Vega 56 Red Devil52,6
-
AMD Radeon RX Vega 5651,8
-
Asus GeForce GTX 1060 Strix46,7
-
Nvidia GeForce GTX 106044,3
-
Nvidia GeForce GTX 97035,1
-
Nvidia GeForce GTX 1050 Ti31,3
-
Nvidia GeForce GTX 96027,1
-
Sapphire Radeon RX 580 Nitro+24,0
-
AMD Radeon RX 58023,5
-
AMD Radeon RX 57022,6
-
AMD Radeon R9 Fury X22,5
-
AMD Radeon R9 39017,9
-
AMD Radeon R9 38014,4
-
AMD Radeon RX 56012,8
-
-
FPS, Durchschnitt:
-
Asus GeForce GTX 1080 Ti Strix68,1
-
Nvidia GeForce GTX 1080 Ti65,2
-
MSI GeForce GTX 1080 Gaming X54,6
-
Nvidia GeForce GTX 108053,5
-
Nvidia GeForce GTX 1070 Ti50,7
-
Asus GeForce GTX 1070 Strix48,6
-
Asus Radeon RX Vega 64 Strix47,5
-
AMD Radeon RX Vega 6446,8
-
PowerColor RX Vega 56 Red Devil45,6
-
AMD Radeon RX Vega 5644,7
-
Nvidia GeForce GTX 107044,5
-
Razer Blade 15 (GTX 1070 Max-Q)38,8
-
Asus GeForce GTX 1060 Strix37,3
-
Nvidia GeForce GTX 106034,8
-
Sapphire Radeon RX 580 Nitro+34,1
-
AMD Radeon RX 58033,0
-
AMD Radeon R9 Fury X28,9
-
AMD Radeon R9 39028,7
-
AMD Radeon RX 57028,6
-
Nvidia GeForce GTX 97026,9
-
AMD Radeon R9 38020,3
-
Nvidia GeForce GTX 96020,1
-
Nvidia GeForce GTX 1050 Ti19,8
-
AMD Radeon RX 56016,4
-
-
99th Percentile (Frametimes in FPS):
-
Asus GeForce GTX 1080 Ti Strix53,8
-
Nvidia GeForce GTX 1080 Ti53,8
-
MSI GeForce GTX 1080 Gaming X43,5
-
Nvidia GeForce GTX 108042,9
-
Asus Radeon RX Vega 64 Strix41,9
-
AMD Radeon RX Vega 6441,2
-
Nvidia GeForce GTX 1070 Ti40,8
-
PowerColor RX Vega 56 Red Devil40,1
-
AMD Radeon RX Vega 5639,5
-
Razer Blade 15 (GTX 1070 Max-Q)38,8
-
Asus GeForce GTX 1070 Strix38,1
-
Nvidia GeForce GTX 107034,7
-
Asus GeForce GTX 1060 Strix31,2
-
Sapphire Radeon RX 580 Nitro+29,8
-
AMD Radeon RX 58028,3
-
Nvidia GeForce GTX 106028,1
-
AMD Radeon R9 Fury X25,8
-
AMD Radeon R9 39025,3
-
AMD Radeon RX 57025,0
-
Nvidia GeForce GTX 97021,3
-
Nvidia GeForce GTX 1050 Ti16,7
-
Nvidia GeForce GTX 96016,7
-
AMD Radeon RX 56014,2
-
AMD Radeon R9 38010,7
-
-
FPS, Durchschnitt:
-
Asus GeForce GTX 1080 Ti Strix242,8
-
Nvidia GeForce GTX 1080 Ti220,2
-
MSI GeForce GTX 1080 Gaming X182,2
-
Nvidia GeForce GTX 1080169,0
-
Nvidia GeForce GTX 1070 Ti165,6
-
Asus Radeon RX Vega 64 Strix150,7
-
Asus GeForce GTX 1070 Strix149,9
-
AMD Radeon RX Vega 64147,1
-
Nvidia GeForce GTX 1070142,4
-
PowerColor RX Vega 56 Red Devil139,1
-
AMD Radeon RX Vega 56135,8
-
Razer Blade 15 (GTX 1070 Max-Q)121,3
-
AMD Radeon R9 Fury X116,8
-
Asus GeForce GTX 1060 Strix104,5
-
Nvidia GeForce GTX 1060102,1
-
Sapphire Radeon RX 580 Nitro+100,9
-
AMD Radeon RX 58099,7
-
AMD Radeon RX 57092,3
-
Nvidia GeForce GTX 97091,6
-
AMD Radeon R9 39084,3
-
Nvidia GeForce GTX 1050 Ti62,0
-
AMD Radeon R9 38061,5
-
Nvidia GeForce GTX 96056,8
-
AMD Radeon RX 56046,7
-
-
99th Percentile (Frametimes in FPS):
-
Asus GeForce GTX 1080 Ti Strix192,3
-
Nvidia GeForce GTX 1080 Ti192,3
-
MSI GeForce GTX 1080 Gaming X172,4
-
Nvidia GeForce GTX 1080156,3
-
Nvidia GeForce GTX 1070 Ti153,9
-
Asus Radeon RX Vega 64 Strix142,4
-
Asus GeForce GTX 1070 Strix140,9
-
AMD Radeon RX Vega 64137,0
-
Nvidia GeForce GTX 1070133,3
-
PowerColor RX Vega 56 Red Devil128,2
-
AMD Radeon RX Vega 56123,5
-
Razer Blade 15 (GTX 1070 Max-Q)121,3
-
AMD Radeon R9 Fury X108,7
-
Asus GeForce GTX 1060 Strix97,2
-
Sapphire Radeon RX 580 Nitro+94,3
-
Nvidia GeForce GTX 106094,3
-
AMD Radeon RX 58093,5
-
AMD Radeon RX 57087,0
-
Nvidia GeForce GTX 97085,5
-
AMD Radeon R9 39078,7
-
AMD Radeon R9 38058,1
-
Nvidia GeForce GTX 1050 Ti58,1
-
Nvidia GeForce GTX 96052,4
-
AMD Radeon RX 56043,1
-
-
FPS, Durchschnitt:
-
Asus GeForce GTX 1080 Ti Strix111,2
-
Nvidia GeForce GTX 1080 Ti104,6
-
Asus Radeon RX Vega 64 Strix85,2
-
MSI GeForce GTX 1080 Gaming X82,7
-
AMD Radeon RX Vega 6482,4
-
Nvidia GeForce GTX 1070 Ti79,2
-
PowerColor RX Vega 56 Red Devil78,9
-
Nvidia GeForce GTX 108078,1
-
AMD Radeon RX Vega 5674,8
-
Asus GeForce GTX 1070 Strix71,8
-
Nvidia GeForce GTX 107066,1
-
Razer Blade 15 (GTX 1070 Max-Q)55,8
-
AMD Radeon R9 Fury X53,7
-
Nvidia GeForce GTX 97052,7
-
Sapphire Radeon RX 580 Nitro+51,6
-
AMD Radeon RX 58050,6
-
Asus GeForce GTX 1060 Strix48,5
-
AMD Radeon RX 57044,9
-
Nvidia GeForce GTX 106044,3
-
AMD Radeon R9 39037,7
-
AMD Radeon R9 38029,9
-
Nvidia GeForce GTX 1050 Ti25,3
-
AMD Radeon RX 56023,8
-
Nvidia GeForce GTX 96023,8
-
-
99th Percentile (Frametimes in FPS):
-
Asus GeForce GTX 1080 Ti Strix94,3
-
Nvidia GeForce GTX 1080 Ti90,1
-
Asus Radeon RX Vega 64 Strix76,1
-
AMD Radeon RX Vega 6473,5
-
MSI GeForce GTX 1080 Gaming X73,1
-
Nvidia GeForce GTX 108069,0
-
Nvidia GeForce GTX 1070 Ti69,0
-
PowerColor RX Vega 56 Red Devil66,7
-
AMD Radeon RX Vega 5663,7
-
Asus GeForce GTX 1070 Strix62,2
-
Nvidia GeForce GTX 107056,5
-
Razer Blade 15 (GTX 1070 Max-Q)55,8
-
Sapphire Radeon RX 580 Nitro+47,9
-
Nvidia GeForce GTX 97046,7
-
AMD Radeon R9 Fury X46,3
-
AMD Radeon RX 58044,4
-
Asus GeForce GTX 1060 Strix40,3
-
AMD Radeon RX 57039,8
-
Nvidia GeForce GTX 106037,0
-
AMD Radeon R9 39033,1
-
AMD Radeon R9 38026,3
-
Nvidia GeForce GTX 1050 Ti20,4
-
AMD Radeon RX 56019,5
-
Nvidia GeForce GTX 96019,1
-
-
FPS, Durchschnitt:
-
Asus Radeon RX Vega 64 Strix144,1
-
AMD Radeon RX Vega 64139,9
-
Asus GeForce GTX 1080 Ti Strix129,5
-
PowerColor RX Vega 56 Red Devil124,3
-
Nvidia GeForce GTX 1080 Ti122,6
-
AMD Radeon RX Vega 56120,9
-
MSI GeForce GTX 1080 Gaming X104,8
-
Nvidia GeForce GTX 108097,5
-
Nvidia GeForce GTX 1070 Ti96,8
-
Asus GeForce GTX 1070 Strix90,5
-
Sapphire Radeon RX 580 Nitro+85,5
-
Nvidia GeForce GTX 107083,8
-
AMD Radeon RX 58083,5
-
Razer Blade 15 (GTX 1070 Max-Q)78,3
-
AMD Radeon R9 39068,5
-
Asus GeForce GTX 1060 Strix67,8
-
AMD Radeon RX 57062,2
-
Nvidia GeForce GTX 106061,5
-
AMD Radeon R9 Fury X38,6
-
AMD Radeon R9 38034,0
-
Nvidia GeForce GTX 1050 Ti32,2
-
Nvidia GeForce GTX 96032,2
-
Nvidia GeForce GTX 97030,5
-
AMD Radeon RX 56029,9
-
-
99th Percentile (Frametimes in FPS):
-
Asus Radeon RX Vega 64 Strix120,4
-
AMD Radeon RX Vega 64115,0
-
PowerColor RX Vega 56 Red Devil105,2
-
Asus GeForce GTX 1080 Ti Strix102,0
-
AMD Radeon RX Vega 5699,0
-
Nvidia GeForce GTX 1080 Ti95,2
-
MSI GeForce GTX 1080 Gaming X84,8
-
Razer Blade 15 (GTX 1070 Max-Q)78,3
-
Nvidia GeForce GTX 108078,1
-
Nvidia GeForce GTX 1070 Ti77,5
-
Asus GeForce GTX 1070 Strix74,6
-
Sapphire Radeon RX 580 Nitro+69,9
-
AMD Radeon RX 58069,0
-
Nvidia GeForce GTX 107067,1
-
Asus GeForce GTX 1060 Strix53,6
-
AMD Radeon R9 39053,2
-
Nvidia GeForce GTX 106048,1
-
AMD Radeon RX 57047,6
-
AMD Radeon R9 Fury X29,0
-
AMD Radeon R9 38026,7
-
Nvidia GeForce GTX 96026,7
-
Nvidia GeForce GTX 1050 Ti25,8
-
Nvidia GeForce GTX 97025,6
-
AMD Radeon RX 56021,6
-
Leistung Laufwerke
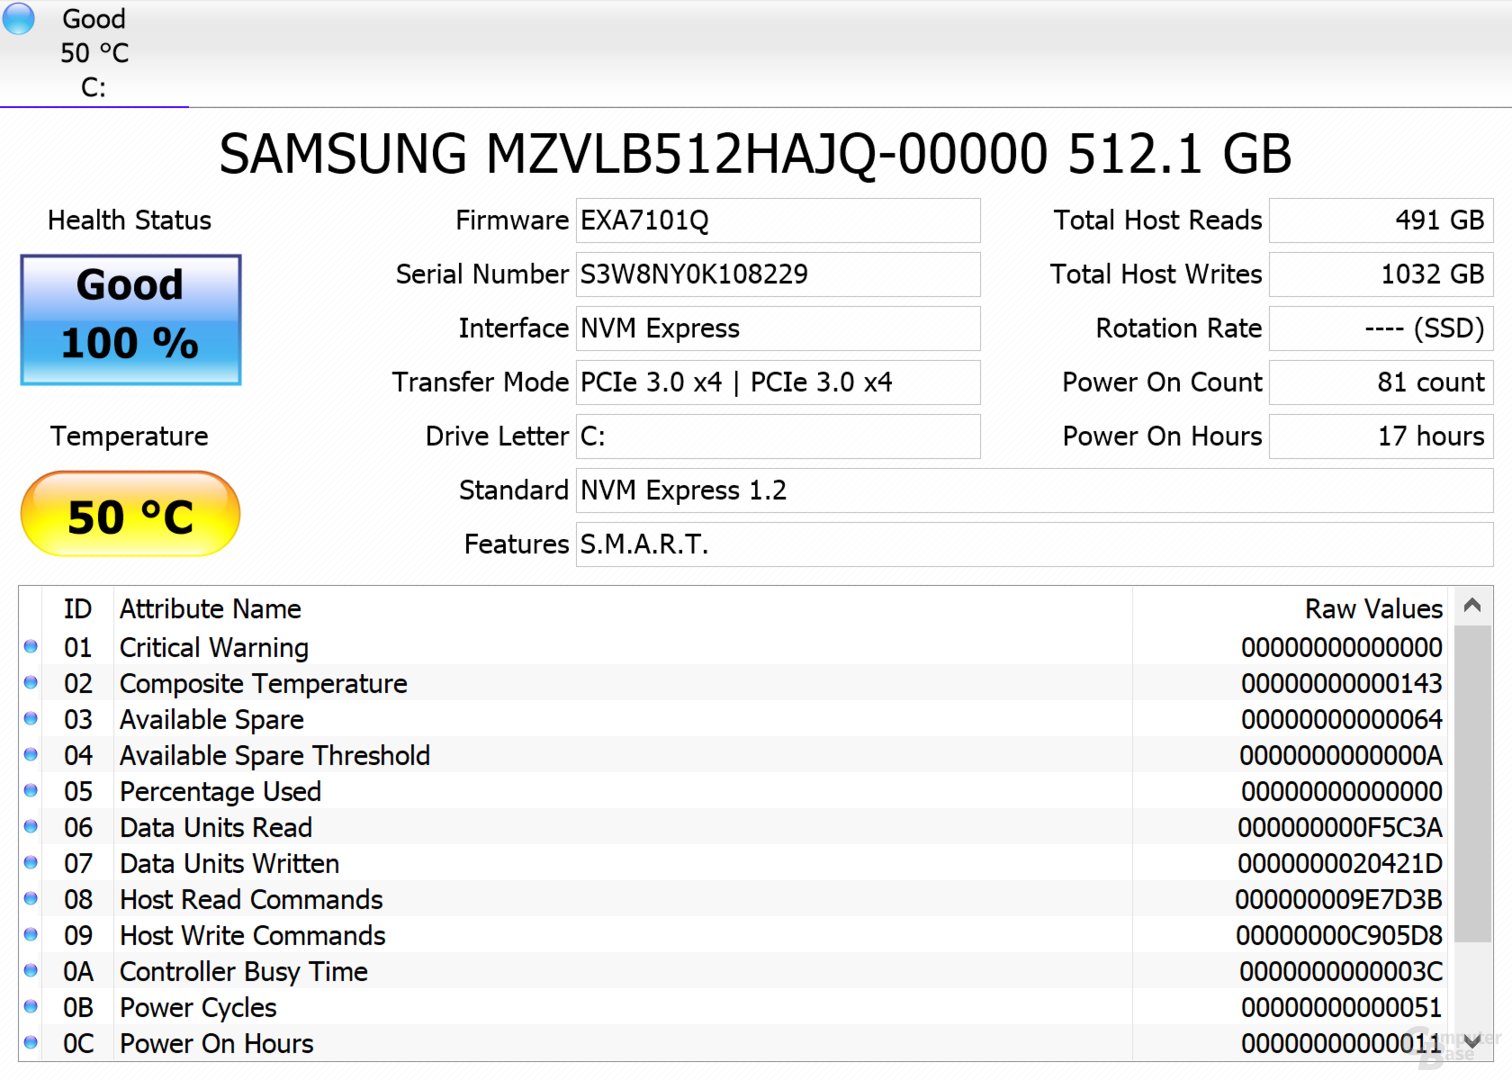
Razer setzt (wie beispielsweise auch Lenovo im Carbon X1 G6 (Test)) auf die NVMe-SSD Samsung PM981, im Testmodell mit 512 GB Kapazität. Dabei handelt es sich um die OEM-Version der Samsung SSD 970 Pro (Test).
Doch während die SSD im Notebook von Lenovo auch in deren Leistungsregionen vorstößt, ist sie im Razer Blade 15 vergleichsweise langsam unterwegs – nur ca. 2.500 MB/s beim sequentiellen Lesen liegen 30 Prozent unter den Erwartungen. In anderen Benchmarks passen die Ergebnisse wiederum – auch unter Berücksichtigung der stärkeren CPU. Auch die Installation des aktuellen NVMe-Treibers von Samsung brachte in Bezug auf den Rückstand beim sequentiellen Lesen keine Abhilfe.
- Seq Q32T1 Read
- Seq Q32T1 Write
- 4KiB Q8T8 Read
- 4KiB Q8T8 Write
- 4KiB Q32T1 Read
- 4KiB Q32T1 Write
- 4KiB Q1T1 Read
- 4KiB Q1T1 Write
-
-
Lenovo ThinkPad X1 Carbon G6 (Core i7-8550U)3.286,7
-
Dell XPS 13 (9370) (Core i7-8550U)3.129,5
-
Razer Blade 15 (Core i7-8750H)2.544,3
-
Microsoft Surface Book 2 15" (Core i7-8650U)2.183,4
-
Dell XPS 13 (9360) (Core i5-7200U)1.717,1
-
-
-
Lenovo ThinkPad X1 Carbon G6 (Core i7-8550U)2.394,60
-
Razer Blade 15 (Core i7-8750H)1.944,50
-
Medion P7651 (Core i7-8550U)769,50
-
Microsoft Surface Book 2 15" (Core i7-8650U)639,90
-
Dell XPS 13 (9370) (Core i7-8550U)532,70
-
-
-
Dell XPS 13 (9370) (Core i7-8550U)1.032,80
-
Razer Blade 15 (Core i7-8750H)1.014,50
-
Lenovo ThinkPad X1 Carbon G6 (Core i7-8550U)833,00
-
Microsoft Surface Book 2 15" (Core i7-8650U)703,70
-
Dell XPS 13 (9360) (Core i5-7200U)506,70
-
-
-
Razer Blade 15 (Core i7-8750H)737,80
-
Dell XPS 13 (9370) (Core i7-8550U)462,00
-
Lenovo ThinkPad X1 Carbon G6 (Core i7-8550U)355,80
-
Dell XPS 13 (9360) (Core i5-7200U)274,60
-
Microsoft Surface Book 2 15" (Core i7-8650U)250,40
-
-
-
Dell XPS 13 (9370) (Core i7-8550U)431,20
-
Razer Blade 15 (Core i7-8750H)405,60
-
Lenovo ThinkPad X1 Carbon G6 (Core i7-8550U)288,80
-
Microsoft Surface Book 2 15" (Core i7-8650U)278,90
-
Dell XPS 13 (9360) (Core i5-7200U)226,10
-
-
-
Dell XPS 13 (9370) (Core i7-8550U)428,50
-
Lenovo ThinkPad X1 Carbon G6 (Core i7-8550U)356,50
-
Razer Blade 15 (Core i7-8750H)352,10
-
Microsoft Surface Book 2 15" (Core i7-8650U)262,90
-
Dell XPS 13 (9360) (Core i5-7200U)246,60
-
-
-
Dell XPS 13 (9370) (Core i7-8550U)48,06
-
Lenovo ThinkPad X1 Carbon G6 (Core i7-8550U)42,02
-
Razer Blade 15 (Core i7-8750H)41,16
-
Microsoft Surface Book 2 15" (Core i7-8650U)39,58
-
Dell XPS 13 (9360) (Core i5-7200U)36,56
-
-
-
Dell XPS 13 (9370) (Core i7-8550U)131,40
-
Razer Blade 15 (Core i7-8750H)113,30
-
Lenovo ThinkPad X1 Carbon G6 (Core i7-8550U)112,40
-
Microsoft Surface Book 2 15" (Core i7-8650U)102,80
-
Dell XPS 13 (9360) (Core i5-7200U)82,30
-
An den Temperaturen kann es dabei nicht gelegen haben. Die sind mit bis zu 75 °C unter Last zwar hoch und fallen auch im Leerlauf nicht unter 45 °C, gedrosselt wird die SSD aber erst ab 79 °C.
- Bester Maus- und Tastatur-Hersteller
- Bester PC-Gehäuse-Hersteller
- Bester NAS-Hersteller
- Alle Wahlen im Überblick...